Introduction: The Illusion of SMA200 Simplicity
Do you make money with it?
The 200 Simple Moving Average (SMA) is one of the most well-known indicators in technical analysis.
It’s the default line on most trading platforms, the go-to for beginners, and often praised as the “line between bullish and bearish territory.”
I followed the rules. I waited patiently for the price to cross the 200 SMA.
I believed I was trading with the trend. And yet, I lost nearly everything.
This article breaks down my experience, highlights the flaws in the strategy, and explains how you can avoid similar mistakes by understanding the deeper dynamics of price action.
I’ll also show you a smarter way forward—with automation, precision, and backtested logic.
200 SMA Strategy Overview
The 200 SMA strategy is based on one simple rule: trade in the direction of the trend.
- When price crosses above the 200 SMA, go long.
- When it crosses below, go short.
Clean. Logical. But often, disastrously late.
Follow the trend. Stay in the trade as long as the trend holds. Exit when it reverses.
But markets don’t move in straight lines.
They range from fakeouts to spikes and traps.
And this is where the 200 SMA often becomes your worst enemy.
TradingView Indicators Used
- 200 Simple Moving Average (SMA)
- Optional: Volume, RSI, or MACD for confirmation
Buy Entry Conditions
- Price closes above the 200 SMA
- Optional: higher high or bullish engulfing candle
- Trade is executed on the next candle open
Example Buy Setup
1. Price breaks above the 200 SMA.
2. A bullish candle closes above it.
3. The next candle opens — the buy is triggered.
But beware: many of these breakouts are false. Price often retests or whipsaws shortly after crossing the 200 SMA.
Sell Entry Conditions
- Price closes below the 200 SMA
- Optional: lower low or bearish engulfing candle
- Trade is executed on the next candle open
Example Sell Setup
1. Price closes below the 200 SMA.
2. A bearish candle forms.
3. You go short. Often, it’s a trap or temporary pullback.
Stop Loss & Take Profit Rules
- Stop Loss: Below recent swing low (for buys) or above swing high (for sells), or 1.5x ATR
- Take Profit: 2:1 reward-to-risk or trail with a 50 EMA
Why is it failing?
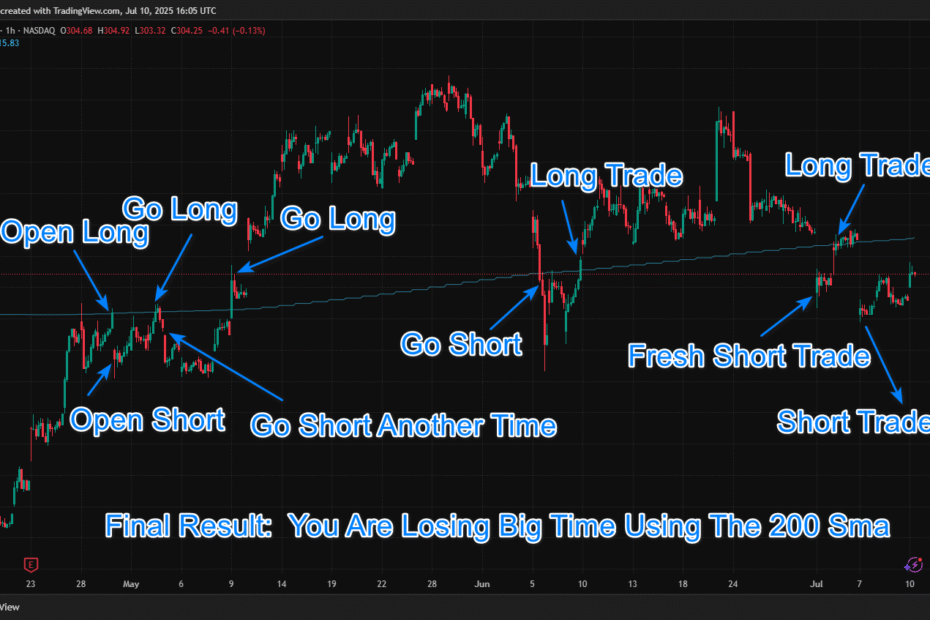
Look at the Tesla 1-Hour Chart Below!!!
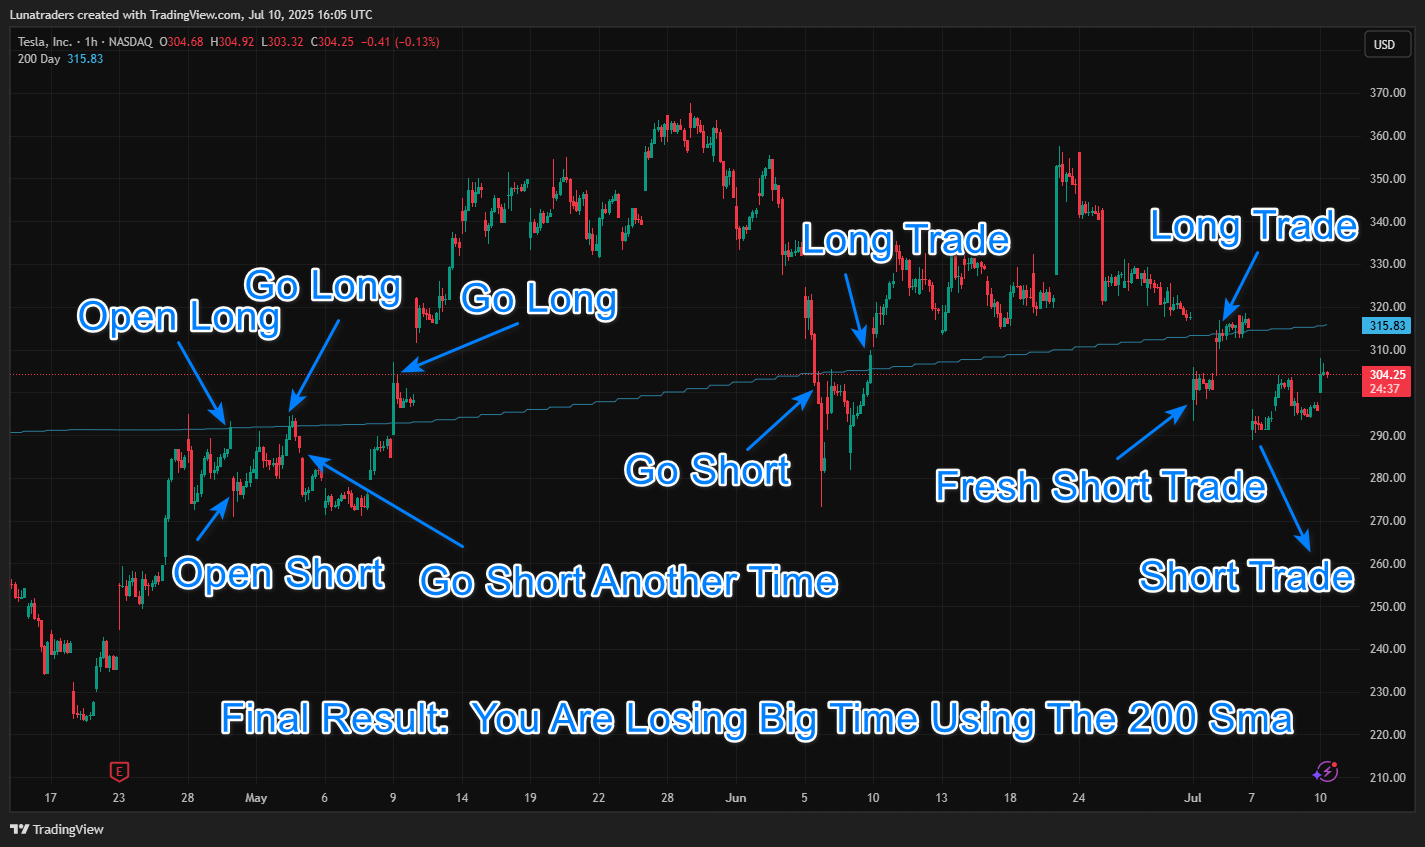
I lost nearly $3,300 by following the basic 200 SMA buy and sell rules. There were too many false signals, the losing trades wiped out the gains from the winners and ultimately pushed me into a net loss.
Backtesting & Optimization Tips
- Use a time filter to avoid choppy sessions (e.g., avoid Asian hours)
- Combine with momentum indicators like RSI or MACD
- Try different MA lengths (e.g., 100 SMA, 150 EMA)
- Add a volatility filter (e.g., Bollinger Band width)
🧠 Pro Tip: Let the Barracuda Indicator Trade for You
Want an indicator that provides intelligent entries, stop loss, take profit targets, and instant alerts? Get it here.
| Condition | Estimated Accuracy | Notes |
|---|---|---|
| Trending Markets | 55–60% | Works decently when there’s strong momentum. Best for trend following. |
| Sideways/Range Markets | 30–45% | Very poor accuracy. Generates many false signals. |
| All Markets Combined | ~40–50% | Often below 50% over large datasets, depending on asset/timeframe. |
| With Confirmation (e.g., RSI) | 55–65% | Improves when used with other indicators for confluence. |
| Intraday (e.g., 5m, 15m) | 35–45% | High noise. Not great standalone on short timeframes. |
| Daily/Weekly Timeframes | 50–55% | Slightly more reliable, especially for swing trades. |
Why Does 200 SMA Work? (And Why It Fails)
Why It Can Work:
- Filters the trend direction
- Clear rules, easy to follow
Why It Often Fails:
- Signals are too late
- Fails in the range of markets
- No context or price structure awareness
🚀 Unlock Smarter Trading with the Barracuda Indicator
Want to automate your strategy with intelligent entries, stop loss, take profit targets, and instant alerts?
Take your trading to the next level with the Premium Barracuda Indicator for TradingView.
- ✅ Instant Buy/Sell Alerts
- ✅ Built-In Take Profit & Stop Loss
- ✅ Intelligent Trend Filters
- ✅ Backtested Performance Metrics
TradingView Strategy Code (Pine Script v5)
//@version=5
strategy("200 SMA Crossover Strategy", overlay=true, default_qty_type=strategy.percent_of_equity, default_qty_value=100)

smaLength = 200
sma = ta.sma(close, smaLength)

longCondition = ta.crossover(close, sma)
shortCondition = ta.crossunder(close, sma)

if (longCondition)
    strategy.entry("Buy", strategy.long)

if (shortCondition)
    strategy.entry("Sell", strategy.short)

atr = ta.atr(14)
sl = atr * 1.5
tp = atr * 3

strategy.exit("Exit Buy", from_entry="Buy", loss=sl, profit=tp)
strategy.exit("Exit Sell", from_entry="Sell", loss=sl, profit=tp)

plot(sma, color=color.orange, title="200 SMA")
Real Trading Examples
EUR/USD — Fakeout Disaster
Price broke above the 200 SMA and triggered a long entry.
Within two candles, it reversed and dropped 100 pips. The SMA lag was too much.
NASDAQ 100 — Clean Trend
In a strong trend, price crossed above the 200 SMA and continued upward. The strategy worked perfectly.
This is when it shines, clear structure, strong momentum.
Final Thoughts
The 200 SMA is not inherently bad, but it’s rarely enough on its own.
Without filters or momentum indicators, it can lead to whipsaws and late signals.
Don’t repeat my mistake. Upgrade your tools. Use automation, stats, and logic.
Let the Barracuda Indicator do the heavy lifting for you.