The MACD (Moving Average Convergence Divergence) and Bollinger Bands are two of the most powerful indicators used in technical analysis.
When combined effectively, they can help traders identify momentum shifts, potential reversals, and breakout opportunities.
This TradingView strategy utilizes the MACD for trend and momentum confirmation, while Bollinger Bands help identify volatility and overbought/oversold conditions.
In this guide, we’ll break down the entry and exit rules, provide code for TradingView’s Pine Script, and offer real-world examples.
Indicators Used
1. MACD
- Components: MACD line (fast EMA – slow EMA), Signal line (EMA of MACD), Histogram (MACD – Signal)
- Default Settings: Fast EMA = 12, Slow EMA = 26, Signal EMA = 9
2. Bollinger Bands
- Components: Middle Band (20-period SMA), Upper and Lower Bands (±2 standard deviations)
- Default Settings: Length = 20, Multiplier = 2
🔓 Power Up Your Trades with the Premium Barracuda Indicator
Ready to automate your strategy with smart entries, built-in stop loss and take profit levels, and real-time alerts?
Unlock precision and speed with the Premium Barracuda Indicator for TradingView.
🔗 Explore the Barracuda Indicator Now
Entry Conditions
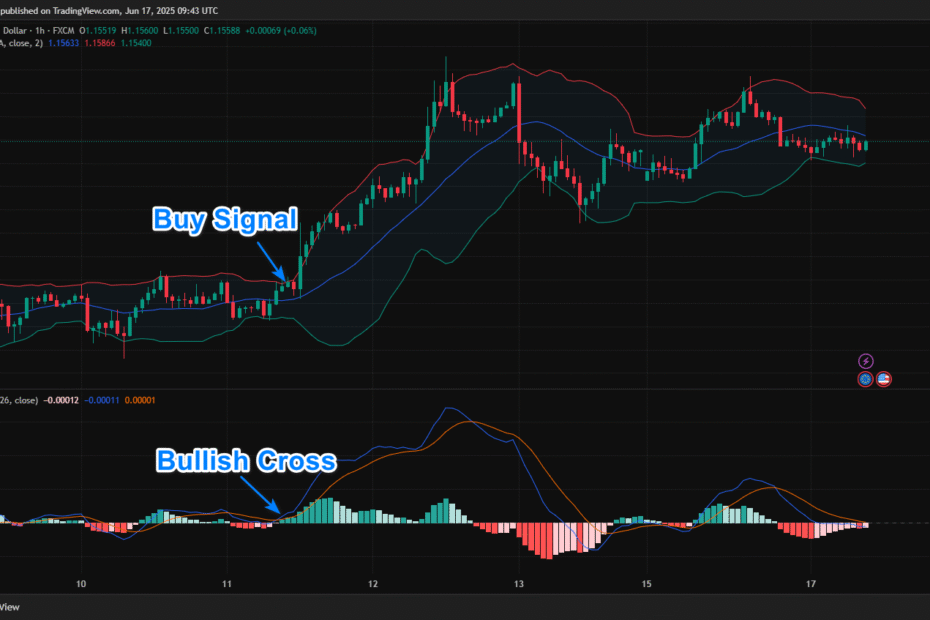
Long Entry
The EURO/US Dollar 1-Hour chart below illustrates a classic buy trade setup.
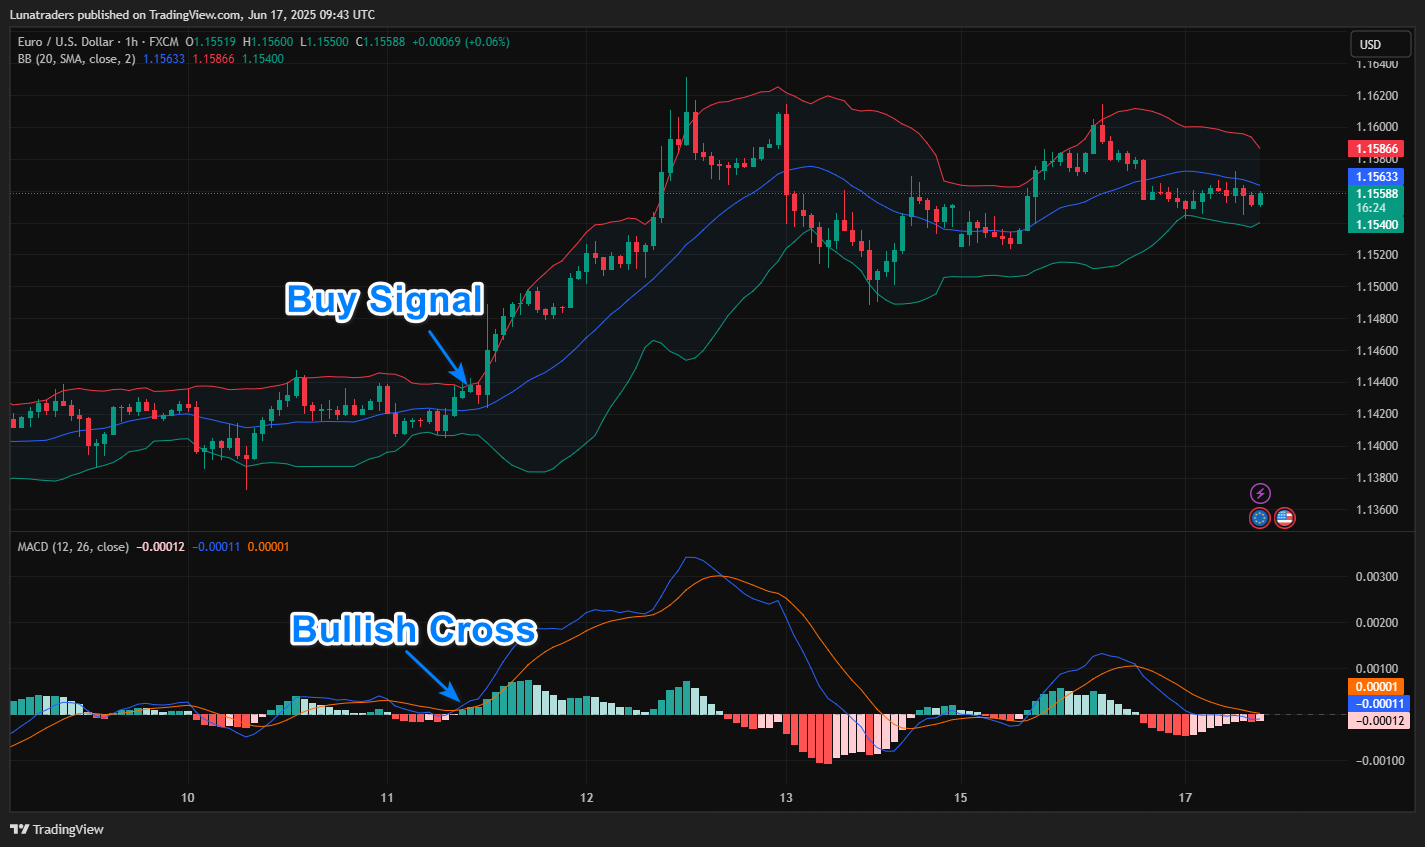
Enter a long (buy) position when:
- MACD Line crosses above Signal Line (bullish crossover)
- Price closes above the upper Bollinger Band, signaling a potential bullish breakout
Short Entry
The Apple 1-Hour stock chart below illustrates a classic sell trade setup.
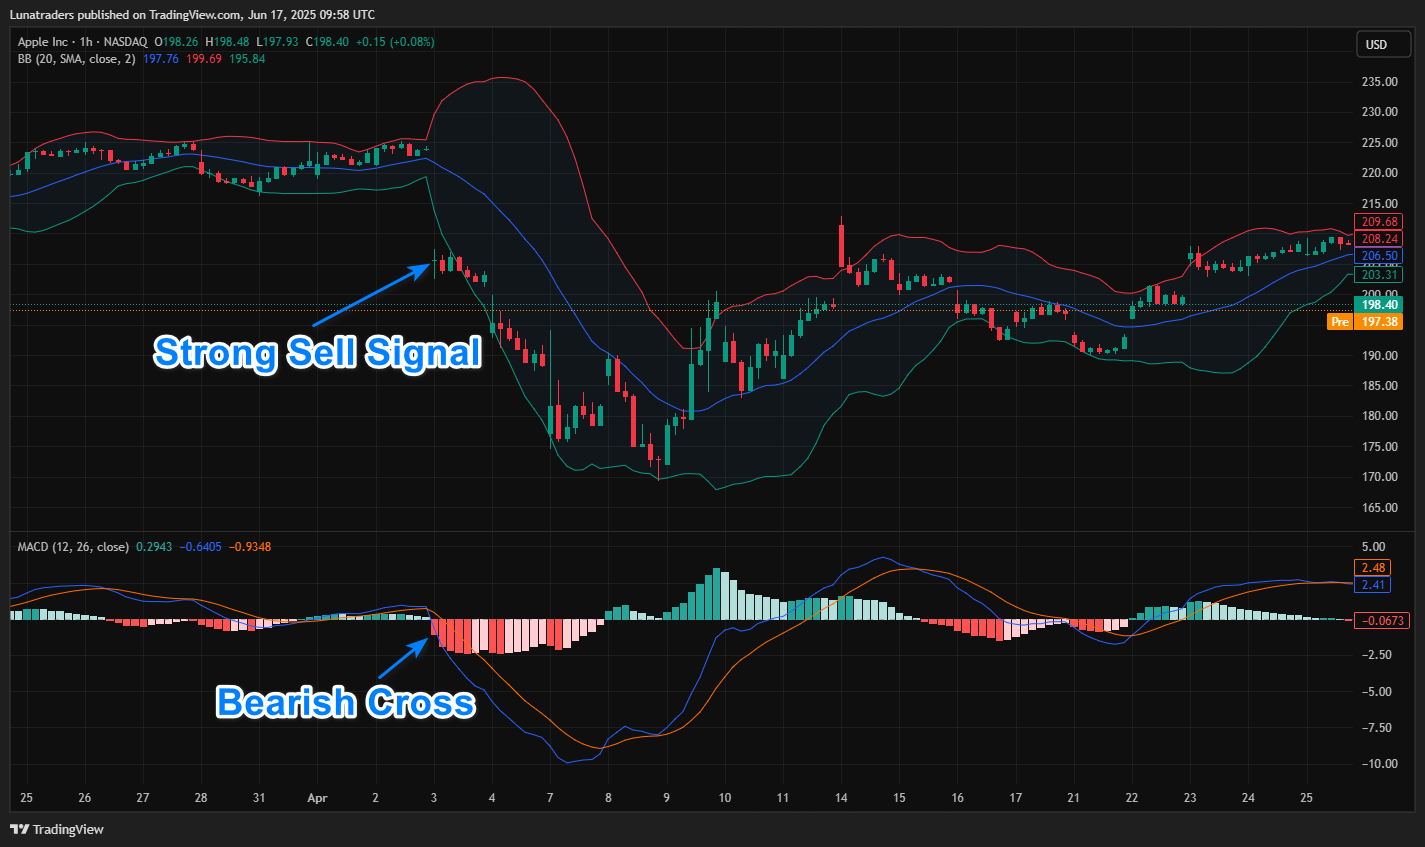
Enter a short (sell) position when:
- MACD Line crosses below Signal Line (bearish crossover)
- Price closes below the lower Bollinger Band, signaling a potential bearish breakout
Exit Conditions
Long Exit
MACD Bearish Crossover: The MACD line crosses below the Signal line, signaling weakening bullish momentum.
Short Exit
MACD Bullish Crossover: The MACD line crosses above the Signal line, signaling weakening bearish momentum.
Alternatively, a stop-loss and take-profit can be added based on ATR or a fixed percentage.
Pine Script Example (TradingView)
//@version=5
strategy(“MACD + Bollinger Band Breakout Strategy”, overlay=true, default_qty_type=strategy.percent_of_equity, default_qty_value=10)
// === Indicator Settings ===
// MACD
[macdLine, signalLine, _] = ta.macd(close, 12, 26, 9)
// Bollinger Bands
length = 20
mult = 2.0
basis = ta.sma(close, length)
dev = mult * ta.stdev(close, length)
upperBB = basis + dev
lowerBB = basis – dev
// === Entry Conditions ===
// Long Entry
bullishMACD = ta.crossover(macdLine, signalLine)
bullishBreakout = close > upperBB
longCondition = bullishMACD and bullishBreakout
// Short Entry
bearishMACD = ta.crossunder(macdLine, signalLine)
bearishBreakdown = close < lowerBB
shortCondition = bearishMACD and bearishBreakdown
// === Exit Conditions ===
exitLong = ta.crossunder(macdLine, signalLine) // Bearish MACD crossover
exitShort = ta.crossover(macdLine, signalLine) // Bullish MACD crossover
// === Trade Execution ===
// Entries
if (longCondition)
strategy.entry(“Long”, strategy.long)
if (shortCondition)
strategy.entry(“Short”, strategy.short)
// Exits
if (exitLong)
strategy.close(“Long”)
if (exitShort)
strategy.close(“Short”)
// === Plotting ===
plot(upperBB, color=color.green, title=”Upper Bollinger Band”)
plot(lowerBB, color=color.red, title=”Lower Bollinger Band”)
plot(basis, color=color.orange, title=”Bollinger Basis”)
Real-World Examples
Example 1: Long Trade on EUR/USD
- Date: March 15, 2024
- Setup: Price closes above the upper Bollinger Band while the MACD line crosses above the signal line
- Action: Buy at 1.0750
- Exit: Sell at 1.0810 (MACD has crossed downward)
- Result: +60 pips profit
Example 2: Short Trade on NASDAQ (QQQ)
- Date: April 10, 2024
- Setup: Price closes below the lower Bollinger Band and MACD crosses downward
- Action: Sell at $365
- Exit: Close trade at $358 (MACD has crossed upward)
- Result: +$7 per share profit
Advantages of This Strategy
- Combines Momentum and Volatility: The MACD indicates momentum shifts, while Bollinger Bands measure volatility and overbought or oversold conditions.
- Mean Reversion Logic: Works well in ranging or slightly trending markets.
- Clear Visual Triggers: Easy to identify setups on a chart.
🔓 Trade Smarter with the Barracuda Indicator
Looking to automate your trading with precise entries, dynamic stop loss and take profit levels, and real-time alerts?
Elevate your strategy with the Premium Barracuda Indicator, built exclusively for TradingView.
🔗 Discover the Barracuda Indicator Today
Tips for Backtesting & Optimization
- Timeframes: This strategy works well on 1-hour to daily charts. Avoid very short timeframes unless optimized for scalping.
- Avoid Strong Trends: In trending markets, Bollinger Band signals can lead to early exits. Use a trend filter like EMA200 if needed.
- Backtest Thoroughly: Before using live, test it on different assets and timeframes.
The default MACD settings (12, 26, 9) work well for most market conditions, but for lower-volatility assets, consider testing faster values like (8, 21, 5) to capture quicker momentum shifts.
You can also tweak the Bollinger Band period from 20 to 14 or 10 if you prefer more trade signals and tighter band sensitivity.
However, for consistency and reliability across assets, sticking with the standard MACD and 20-period Bollinger Bands often delivers the most balanced results.
Conclusion
The MACD + Bollinger Bands strategy is a simple yet powerful approach for identifying high-probability reversal trades.
With clear entry and exit signals and logical rules, it’s suitable for both beginners and experienced traders.
Traders should backtest and customize this strategy based on asset class and market behavior.
For improved performance, consider adding filters like RSI or trend confirmation (e.g., EMA200) to reduce false signals during strong trends.