Introduction: What This Strategy Is About
This trading strategy combines the power of classic candlestick reversal patterns with MACD confirmation to filter out false signals and enhance trade accuracy.
Candlestick patterns reflect real-time price sentiment, while the MACD (Moving Average Convergence Divergence) confirms the momentum behind that move.
The combination enables traders to enter trades with greater confidence.
Why This Combo Strategy Works
Pure candlestick patterns can be deceiving, especially during periods of consolidation.
But when supported by MACD momentum, such as a bullish crossover or bearish divergence, the probability of success significantly increases.
This dual-confirmation method ensures you only act when the price action aligns with the broader market momentum.
🔓 Trade With Premium Barracuda Indicator
Take your trading to the next level with the Premium Barracuda Indicator for TradingView.
Barracuda provides smart buy and sell signals for any asset, profit targets, and instant alerts.
🔗 Discover the Barracuda Indicator Today
Strategy Overview
- Type: Trend-following + Reversal
- Indicators Used: Candlestick Patterns + MACD (12, 26, 9)
- Timeframes: 15min, 1H, or 4H
- Markets: Forex, Crypto, Stocks, Indices
TradingView Indicators Used
- MACD (12, 26, 9) – Signal line crossover to confirm momentum
- Candlestick Patterns – Bullish/Bearish Engulfing, Hammers, Stars, etc.
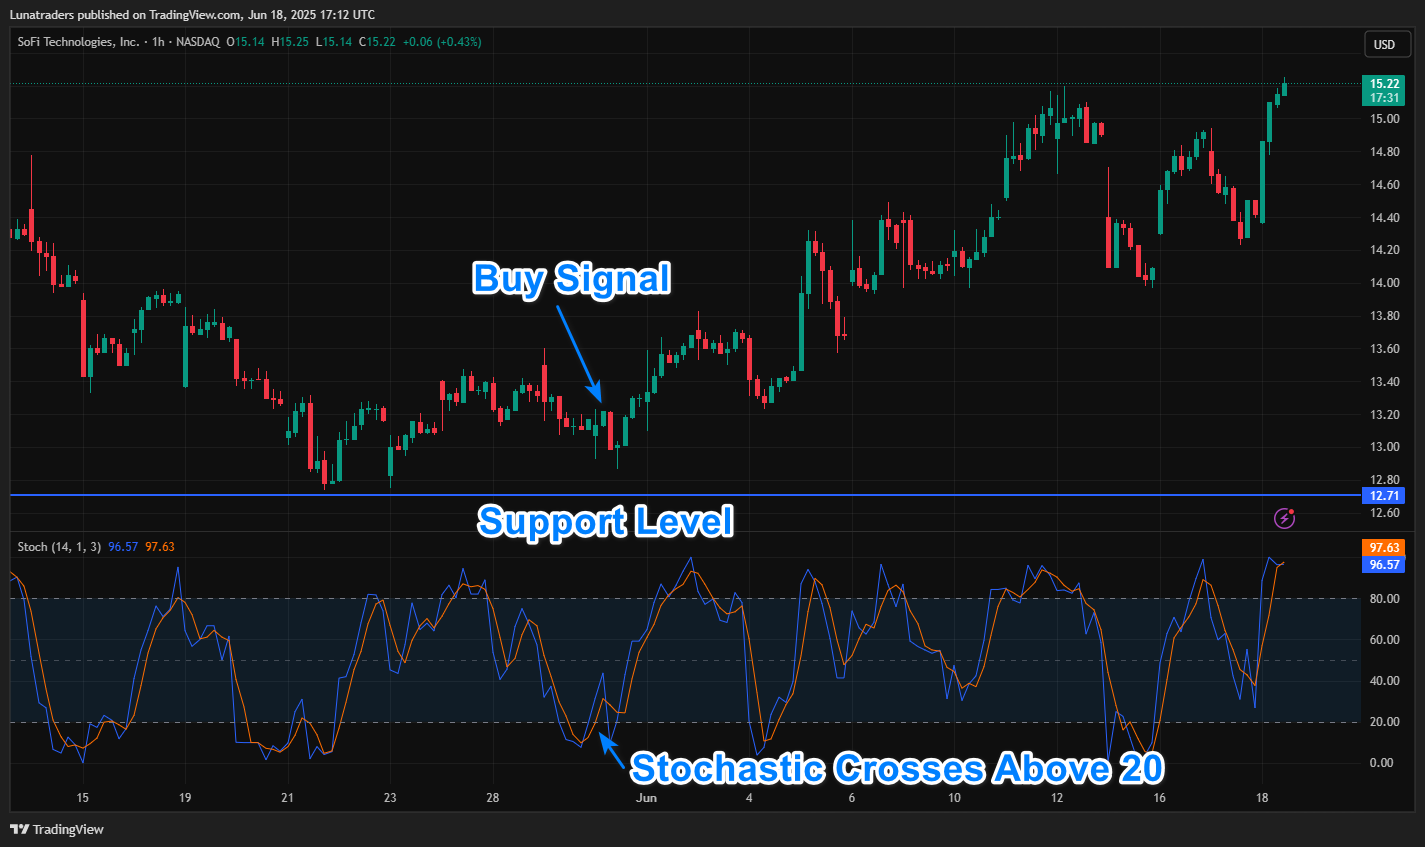
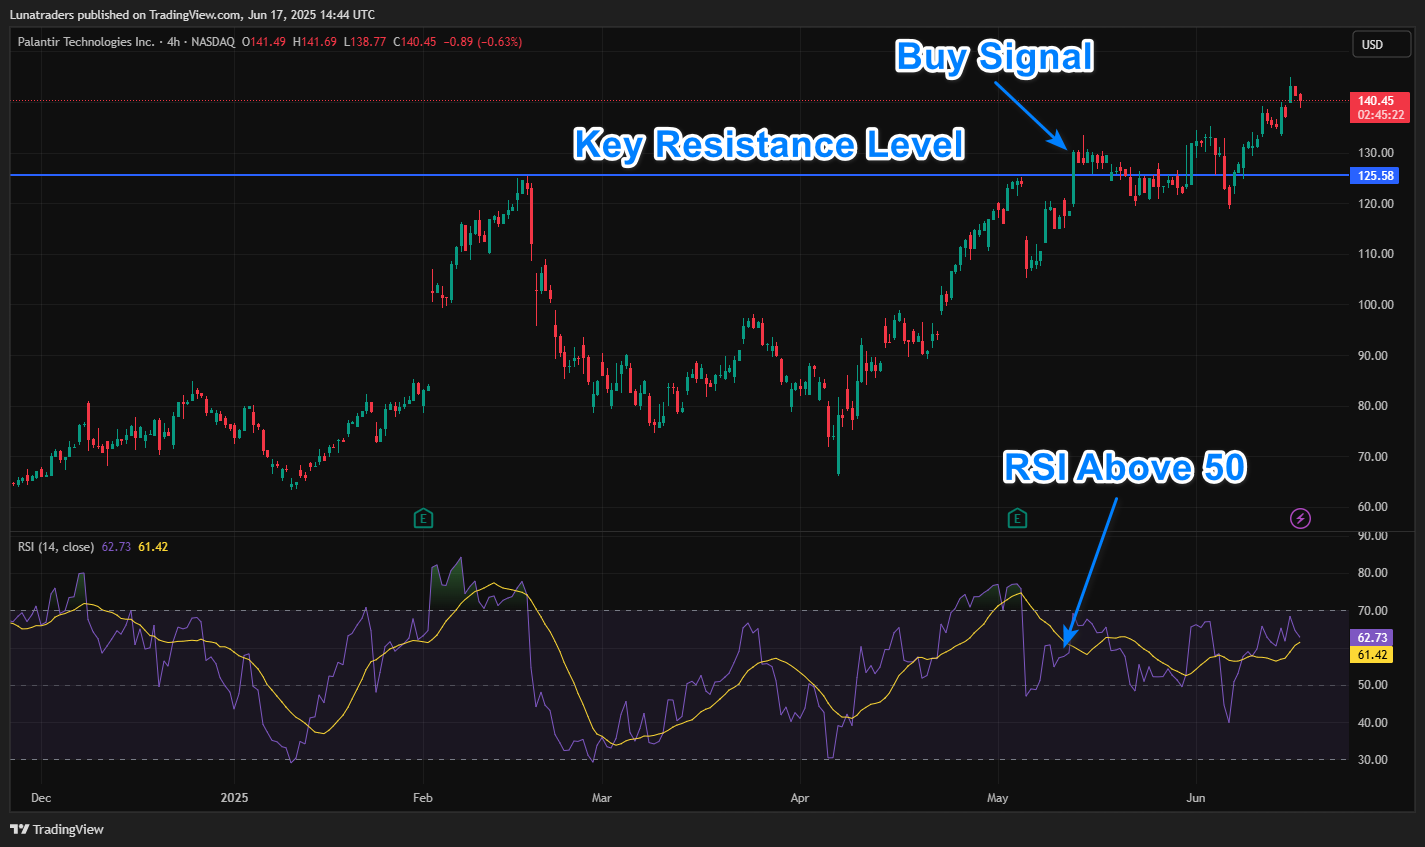
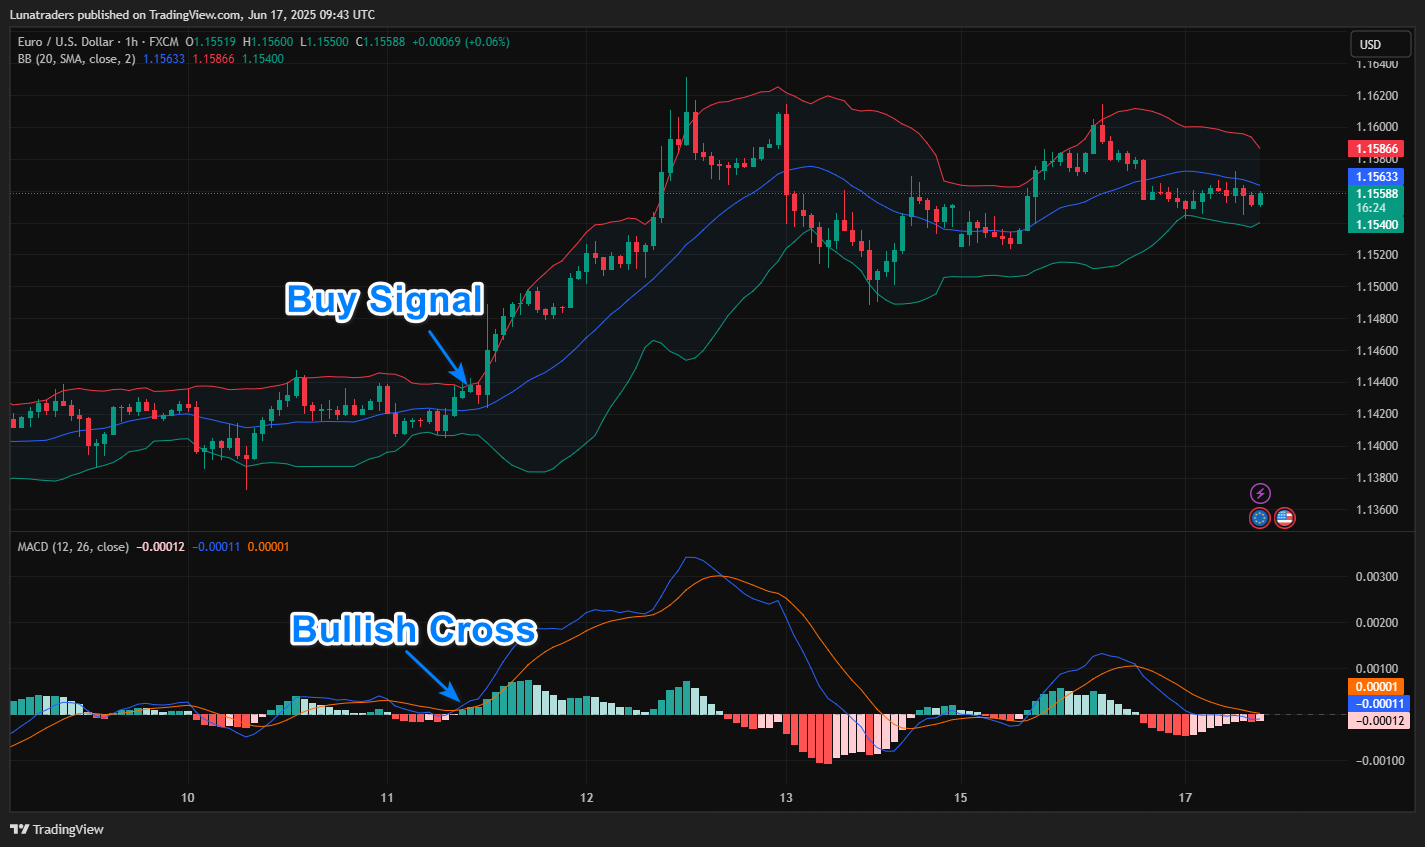
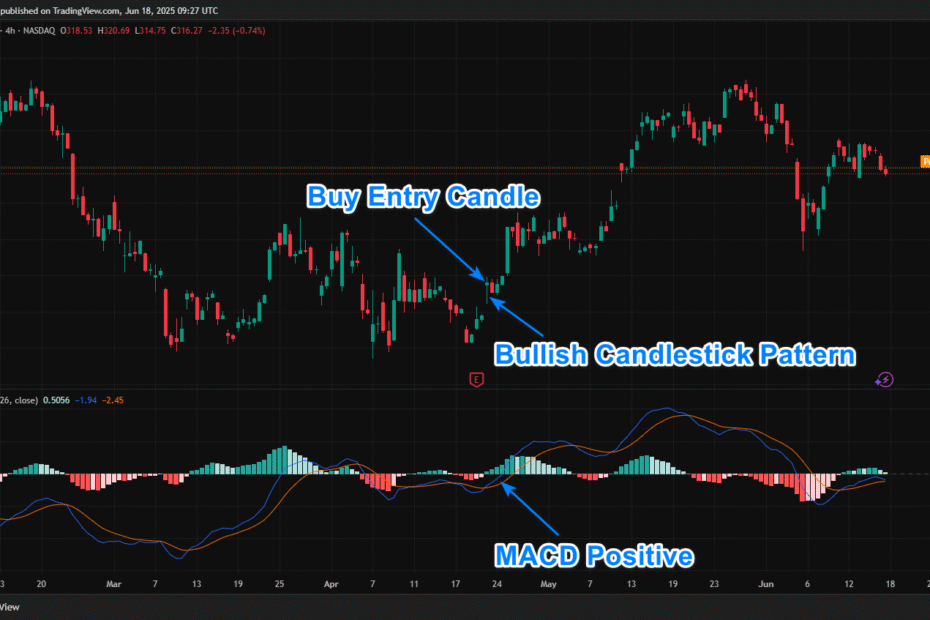
Buy Entry Conditions
Enter a long (buy) trade when:
- A bullish candlestick pattern forms (e.g., Bullish Engulfing, Hammer)
- MACD Line crosses or is above the Signal Line
- Optional: Price is above 50 EMA or near recent support
📈 Example Buy Setup (Tesla Stock Chart)
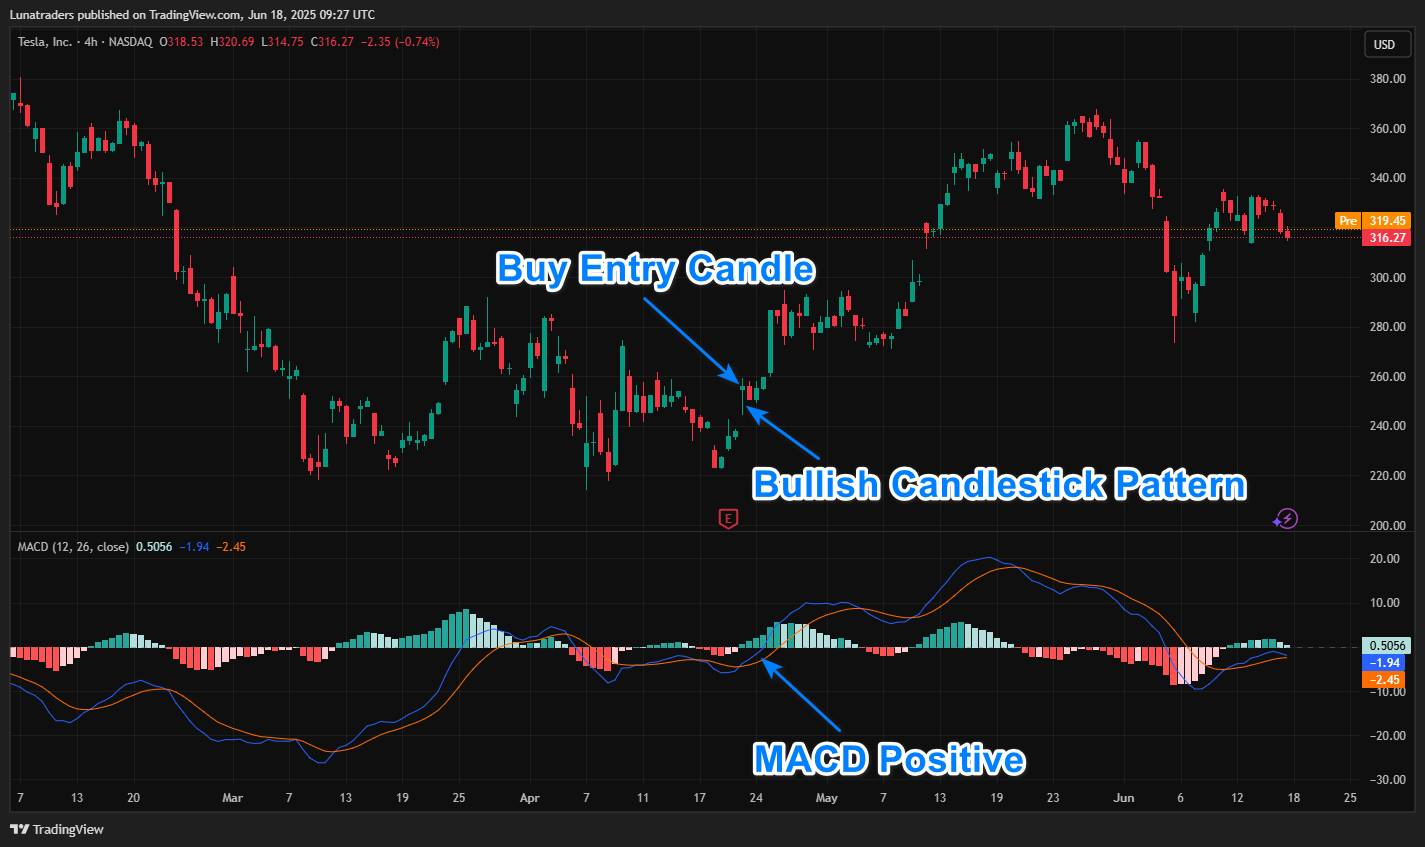
- Bullish pin bar candle on the 4H Tesla stock chart
- MACD trades above its signal line.
- Price bounces from the support zone
- Entry: Above the high of the bullish candle
- Stop Loss: Below the candle’s low
- Take Profit: 1.5:1 R:R or next resistance
Sell Entry Conditions
Enter a short (sell) trade when:
- A bearish candlestick pattern forms (e.g., Bearish Engulfing, Shooting Star, Pin bar)
- MACD Line crosses or is below the Signal Line
- Optional: Price is under 50 EMA or at resistance
📉 Example Sell Setup (Gold Trading Chart)
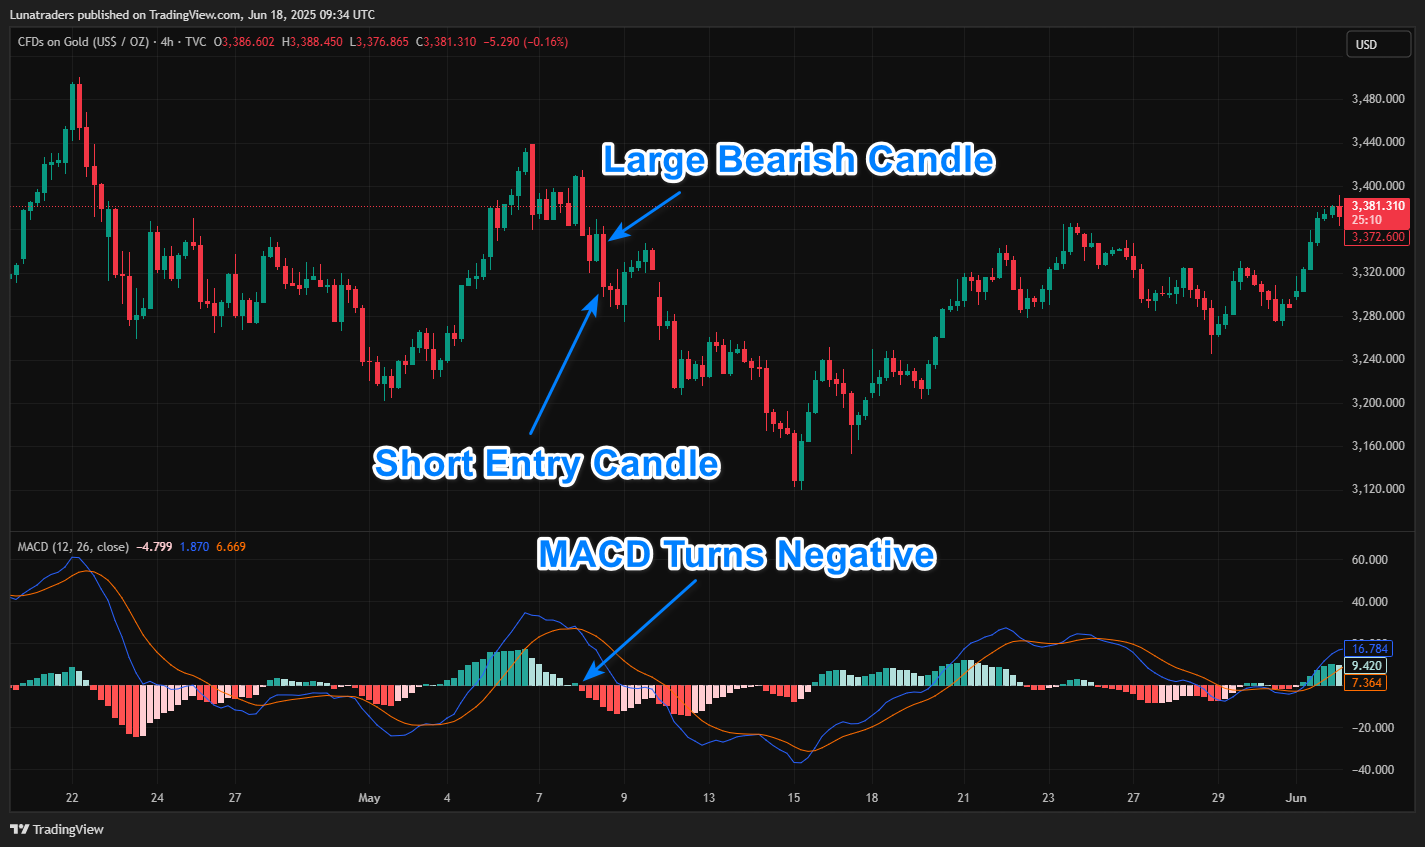
- Large bearish candlestick near swing high on the 4-hour Gold chart
- MACD gives a bearish crossover
- Price rejects the resistance zone
- Entry: Below the candle’s low
- Stop Loss: Above the candle high
- Take Profit: 1.5–2:1 R:R or next support
Stop Loss & Take Profit Rules
- Stop Loss: Below/above the candlestick pattern or swing low/high
- Take Profit: Fixed R:R ratio or trailing stop using ATR or MA
- Optional Exit: Exit if the MACD crosses against your trade direction
Backtesting & Optimization Tips
Pay close attention to the market conditions during your tests.
This strategy tends to work well in trending markets but may produce false signals during choppy or sideways price action.
Incorporate higher timeframe trend filters (like the 200 EMA) to avoid trading against the main trend.
- Test on multiple timeframes (15m to 4H)
- Use higher timeframe trend filters
- Avoid news hours for clearer setups
- Experiment with faster MACD settings (e.g., 6, 19, 5)
- Look for S/R + Candlestick + MACD confluence
🔓 Unlock Smarter Trading with the Barracuda Indicator
Tired of manually spotting patterns and calculating entries?
Automate your strategy with intelligent entries, stop loss, take profit targets, and instant alerts.
🔗 Discover the Premium Barracuda Indicator for TradingView Today
TradingView Strategy Code (Pine Script v5)
//@version=5
strategy("Candlestick + MACD Strategy", overlay=true, default_qty_type=strategy.percent_of_equity, default_qty_value=10)

// MACD
[macdLine, signalLine, _] = ta.macd(close, 12, 26, 9)
macdBull = ta.crossover(macdLine, signalLine)
macdBear = ta.crossunder(macdLine, signalLine)

// Candlestick pattern detection (basic)
bullishEngulfing = close[1] < open[1] and close > open and close > open[1] and open < close[1]
bearishEngulfing = close[1] > open[1] and close < open and close < open[1] and open > close[1]

// Entry Conditions
longCondition = bullishEngulfing and macdBull
shortCondition = bearishEngulfing and macdBear

// Risk management
slPct = 1.5
tpPct = 3.0

if (longCondition)
    strategy.entry("Long", strategy.long)
    strategy.exit("TP/SL", from_entry="Long", stop=close * (1 - slPct/100), limit=close * (1 + tpPct/100))

if (shortCondition)
    strategy.entry("Short", strategy.short)
    strategy.exit("TP/SL", from_entry="Short", stop=close * (1 + slPct/100), limit=close * (1 - tpPct/100))

plotshape(longCondition, title="Buy Signal", location=location.belowbar, color=color.green, style=shape.labelup, text="BUY")
plotshape(shortCondition, title="Sell Signal", location=location.abovebar, color=color.red, style=shape.labeldown, text="SELL")
Real Trading Examples
EUR/USD 1H – Bullish Trade
Bullish Engulfing at support, MACD crossover confirms, and TP hit with 1.8:1 R:R.
BTC/USD 4H – Bearish Trade
Shooting Star + MACD crossover near resistance, TP hit with 2:1 R:R in 12 hours.
Final Thoughts
The Candlestick + MACD Strategy is a smart blend of price action and momentum confirmation.
While no system is flawless, this method filters noise and provides reliable entries when used correctly.