When it comes to identifying high-probability trade setups in trending markets, combining a trend-following indicator like the HMA 200 with a momentum-based volume oscillator like the Klinger Oscillator creates a powerful edge.
This strategy for TradingView charts is ideal for traders who want clean entries, strong confirmation, and a balanced risk-reward profile, especially on 1-hour charts across Forex, crypto, and indices.
We’ll break down exactly how to use the HMA 200 and Klinger Oscillator together in a seamless TradingView strategy, explain the logic behind each rule, and show how you can use this setup to catch big moves while avoiding choppy market noise.
Why Use HMA 200 + Klinger Oscillator?
Before we dive into the rules, let’s understand why this combo works:
- HMA 200 (Hull Moving Average) is smoother and more responsive than traditional moving averages like the SMA or EMA. It reacts faster to price changes, making it excellent for filtering the trend direction without lagging too much.
- Klinger Oscillator is a lesser-known but highly effective volume-based indicator that shows the long-term trend of money flow. It compares volume to price movement to detect whether smart money is buying or selling.
Together, these two indicators provide trend confirmation (HMA 200) and volume-backed momentum (Klinger), giving you a dual-layered confirmation to increase your win rate.
🔓 Pro Tip: Let the Barracuda Indicator Trade for You.
Want to automate your strategy with intelligent entries, stop loss, take profit targets, and instant alerts?
Take your trading to the next level with the Premium Barracuda Indicator for TradingView.
🔗 Discover the Barracuda Indicator Today
Strategy Overview
- Timeframe: 1H (1-Hour)
- Markets: Works well on Forex, Crypto, and Indices
TradingView Indicators Used
- HMA 200 (close)
- Klinger Oscillator (default settings)
Buy Entry Conditions
- Price must be above the HMA 200. This confirms the market is in an uptrend.
- Klinger Oscillator must cross above the Signal Line. Indicates bullish momentum supported by volume.
- Klinger must be above the zero line after the crossover. Additional confirmation that the upward move has strength.
- Optional: Look for bullish price action like a bullish engulfing candle or a breakout.
Example Buy Setup
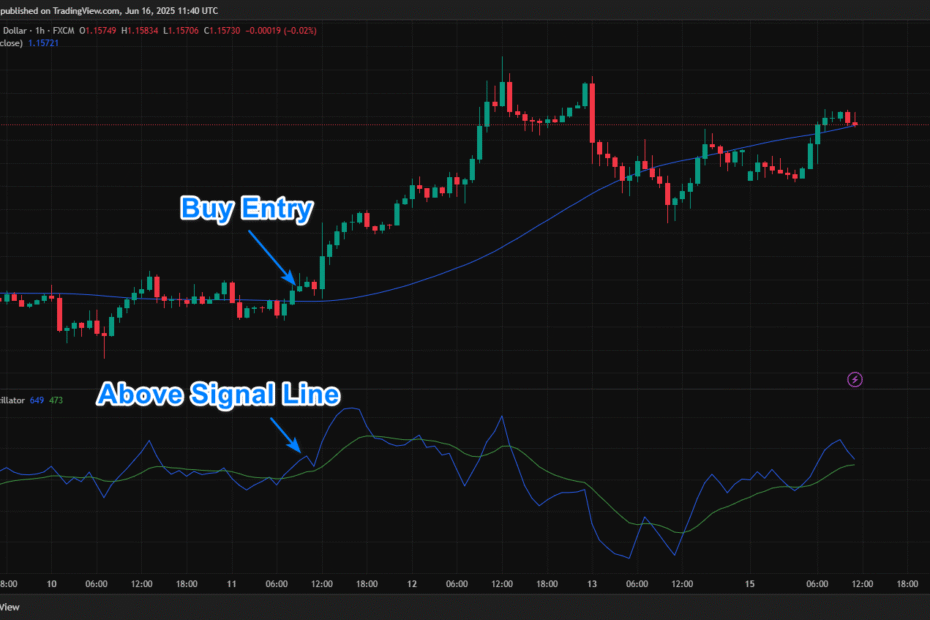
Let’s say EUR/USD is trading on the 1-hour chart:
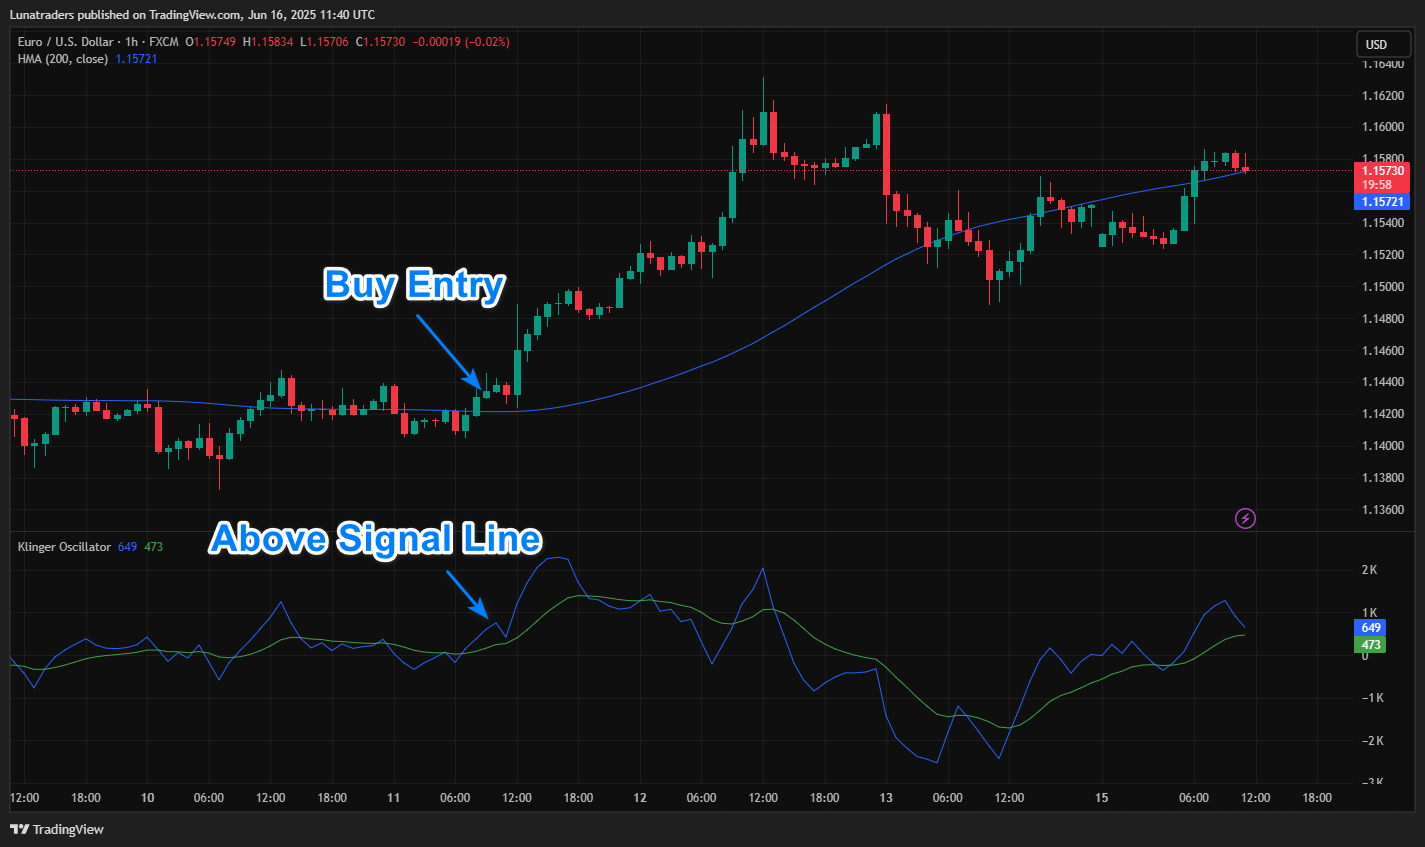
- The price is comfortably above the HMA 200.
- The Klinger Oscillator crosses above its signal line and moves above the zero line.
- A strong bullish candle closes above a mini range.
This would be a solid long setup. Enter at candle close or set a buy-stop just above the high.
Sell Entry Conditions
- Price must be below the HMA 200. Confirms a downtrend.
- Klinger Oscillator must cross below the Signal Line. Indicates bearish momentum.
- Klinger must be below the zero line after the crossover. Confirms strong selling pressure.
- Optional: Look for a bearish candle or breakdown of support.
Example Sell Setup
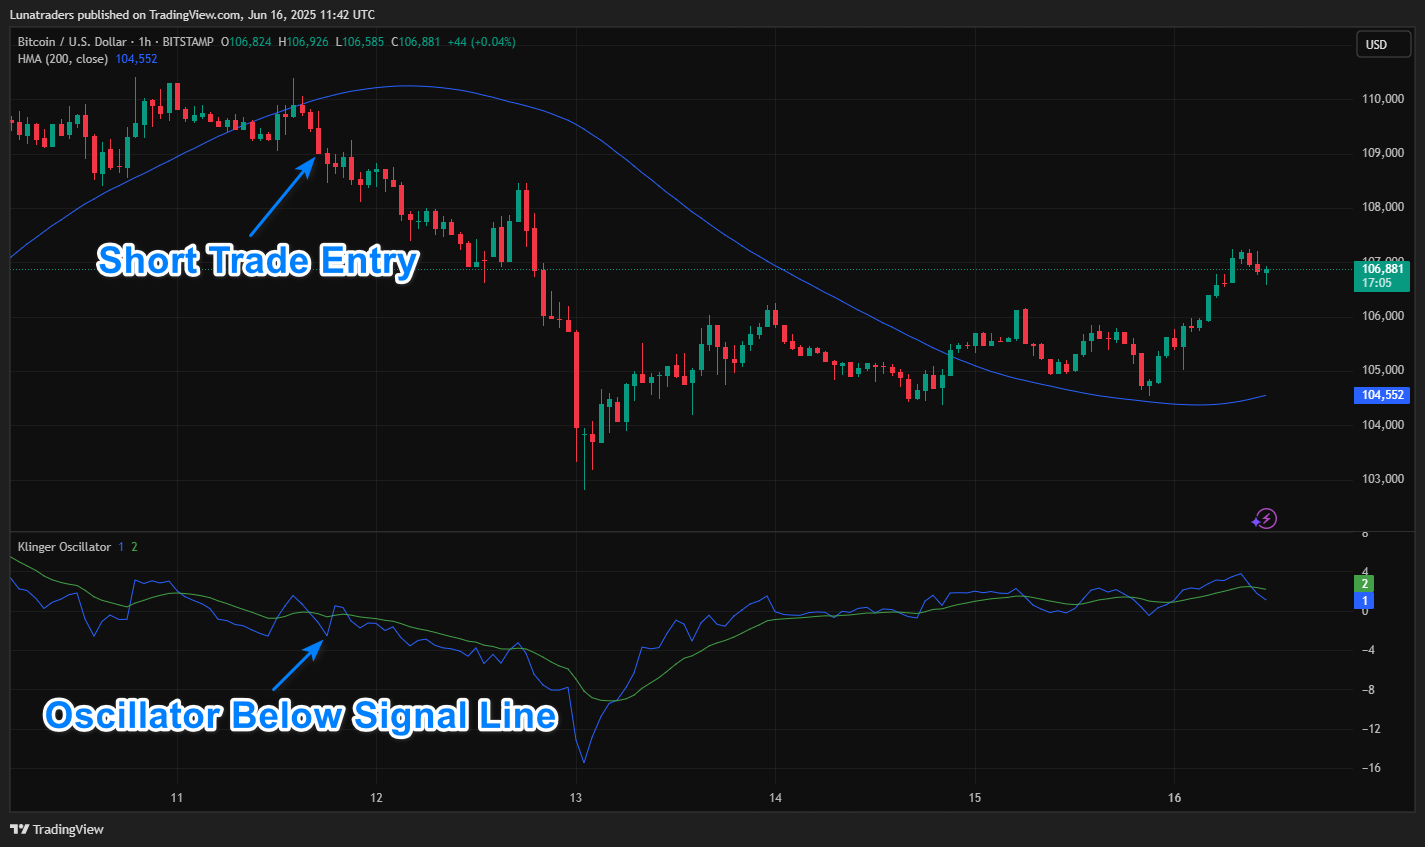
On the 1H chart of BTC/USD:
- Price is trading well below the HMA 200.
- Klinger crosses below its signal line and dips under the zero line.
- A bearish engulfing pattern forms at a resistance zone.
This is a strong short signal for confirmation-based entries.
Stop Loss & Take Profit Rules
Stop Loss:
- For longs: Just below the swing low or the HMA 200.
- For shorts: Above the swing high or the HMA 200.
Take Profit Options:
- Fixed RR – Target a 1:2 or 1:3 risk/reward ratio.
- Trailing Stop – Follow behind recent highs/lows or the HMA line.
- Klinger Exit – Exit when Klinger crosses back against your position.
Backtesting & Optimization Tips
The default Klinger settings (34, 55, 13) are solid, but in lower-volatility assets, try faster settings like (21, 34, 9).
You can also adjust HMA to 150 or 100 if you prefer more trade frequency.
But for overall clarity and reliability, the HMA 200 remains the gold standard for trend detection.
🔓 Unlock Smarter Trading with the Barracuda Indicator
Want to automate your strategy with intelligent entries, stop loss, take profit targets, and instant alerts?
Take your trading to the next level with the Premium Barracuda Indicator for TradingView.
🔗 Discover the Barracuda Indicator Today
TradingView Strategy Code (Pine Script v5)
//@version=5
strategy("HMA 200 + Klinger Strategy", overlay=true)

hma = ta.hma(close, 200)
plot(hma, color=color.orange, linewidth=2)

[kl, sig] = ta.klinger(34, 55, 13)
plot(kl, title="Klinger", color=color.teal)
plot(sig, title="Signal Line", color=color.red)

longCond = close > hma and ta.crossover(kl, sig) and kl > 0
shortCond = close < hma and ta.crossunder(kl, sig) and kl < 0

strategy.entry("Long", strategy.long, when=longCond)
strategy.entry("Short", strategy.short, when=shortCond)

strategy.close("Long", when=ta.crossunder(kl, sig))
strategy.close("Short", when=ta.crossover(kl, sig))
Final Thoughts
The HMA 200 + Klinger Oscillator strategy is an underrated yet powerful approach that aligns trend-following with volume-based confirmation.
It helps filter out false breakouts and keeps you aligned with smart money flows.
For best results:
- Stick to the 1H chart or higher timeframes.
- Avoid trading during low-volume sessions or high-impact news events.
- Apply strict risk management—no strategy wins 100% of the time.