If you’re a trader looking to master the 1-hour chart, the combination of SuperTrend and Relative Strength Index (RSI) is one of the most powerful, beginner-friendly setups you can use.
This article outlines a high-probability trading strategy that utilizes both indicators on TradingView, making it ideal for forex, crypto, and stocks.
Why Use SuperTrend + RSI Indicators?
The SuperTrend indicator is a trend-following tool that plots buy and sell signals based on ATR (Average True Range) and price action.
It gives clear trend direction and entry/exit points.
RSI, on the other hand, is a momentum oscillator that measures the strength of a move and identifies overbought/oversold conditions.
When you combine them:
- SuperTrend tells you which direction to trade.
- RSI confirms if there’s still momentum left in the move.
Why the 1-Hour Chart?
The 1-hour chart is a sweet spot for traders who want fewer false signals than lower timeframes but more frequent opportunities than daily charts.
It provides enough clarity for short-term swings without overwhelming you with noise.
TradingView Indicators Used
- SuperTrend (ATR period: 10, Multiplier: 3)
- RSI (Length: 14, Overbought: 70, Oversold: 30)
These default settings are ideal for most high-volume stocks and forex pairs.
Strategy Goals
This strategy aims to:
- Identify the dominant trend using SuperTrend
- Confirm momentum using RSI
- Reduce whipsaws through dual confirmation
🔓 Tip: Automate Your Trades with the Premium Barracuda Indicator
Looking to automate this strategy with smart entries, stop loss, take profit levels, and real-time alerts?
Upgrade your trading with the premium Barracuda Indicator for TradingView.
🔗 Explore the Barracuda Indicator now
Strategy Rules: SuperTrend + RSI for 1H Chart
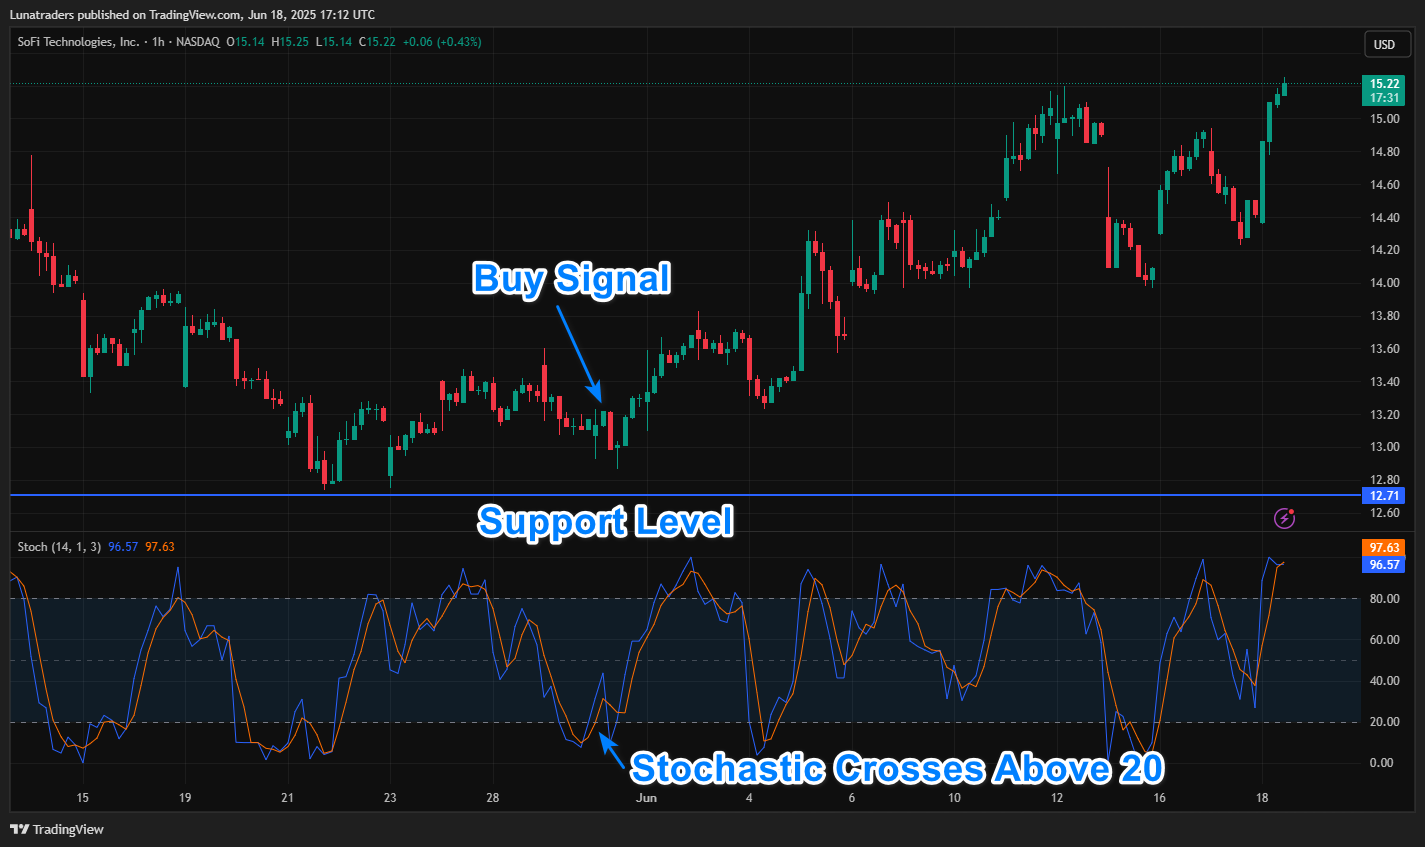
✅ Buy Setup
SuperTrend Turns Green (Buy Signal)
A bullish signal is given when the SuperTrend flips from red to green.
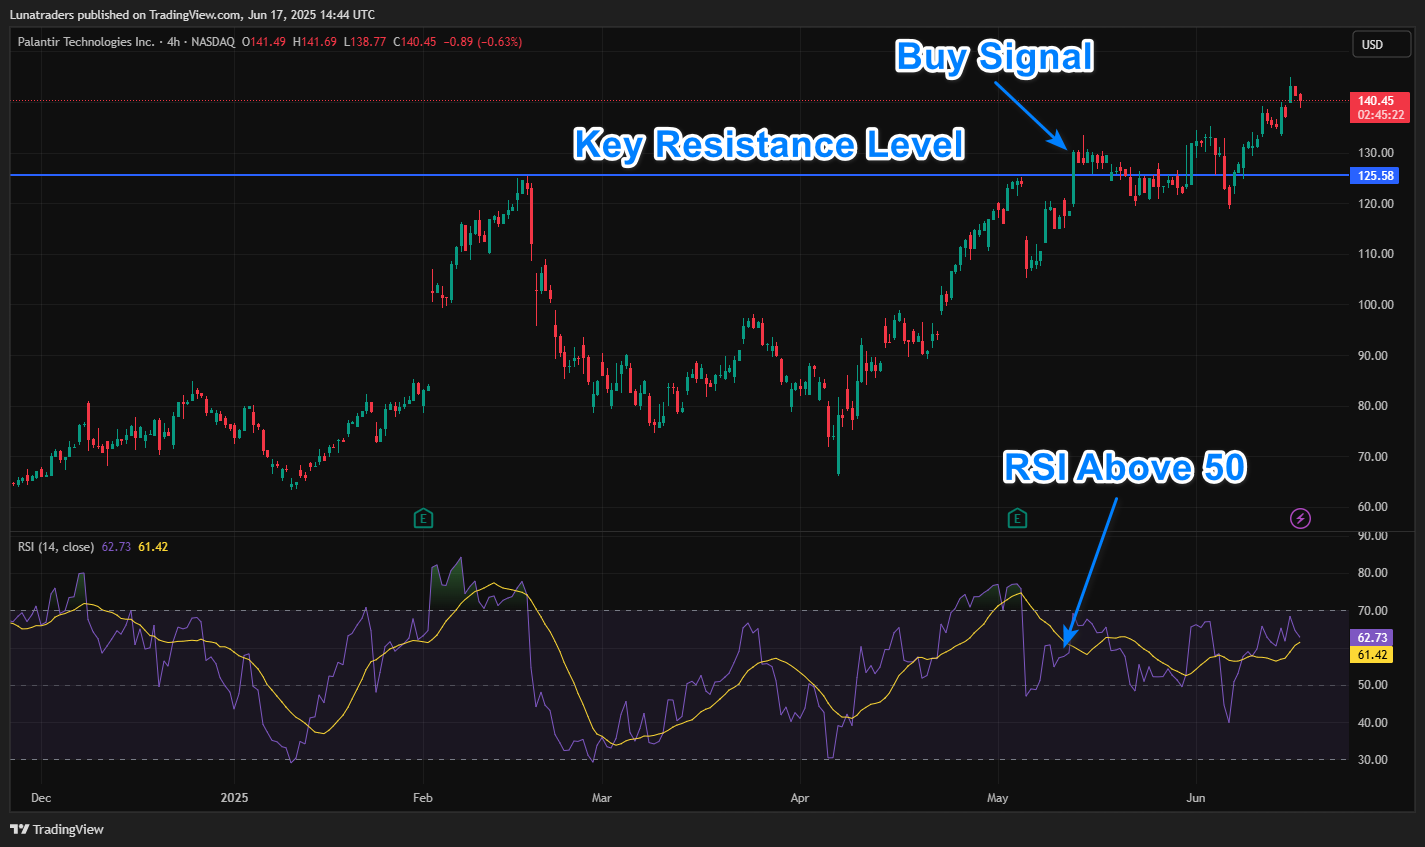
RSI Is Between 40 and 60 at Entry
Avoid buying when RSI is >70 (overbought).
Ideal entry when RSI is rising through 50 — showing building bullish momentum.
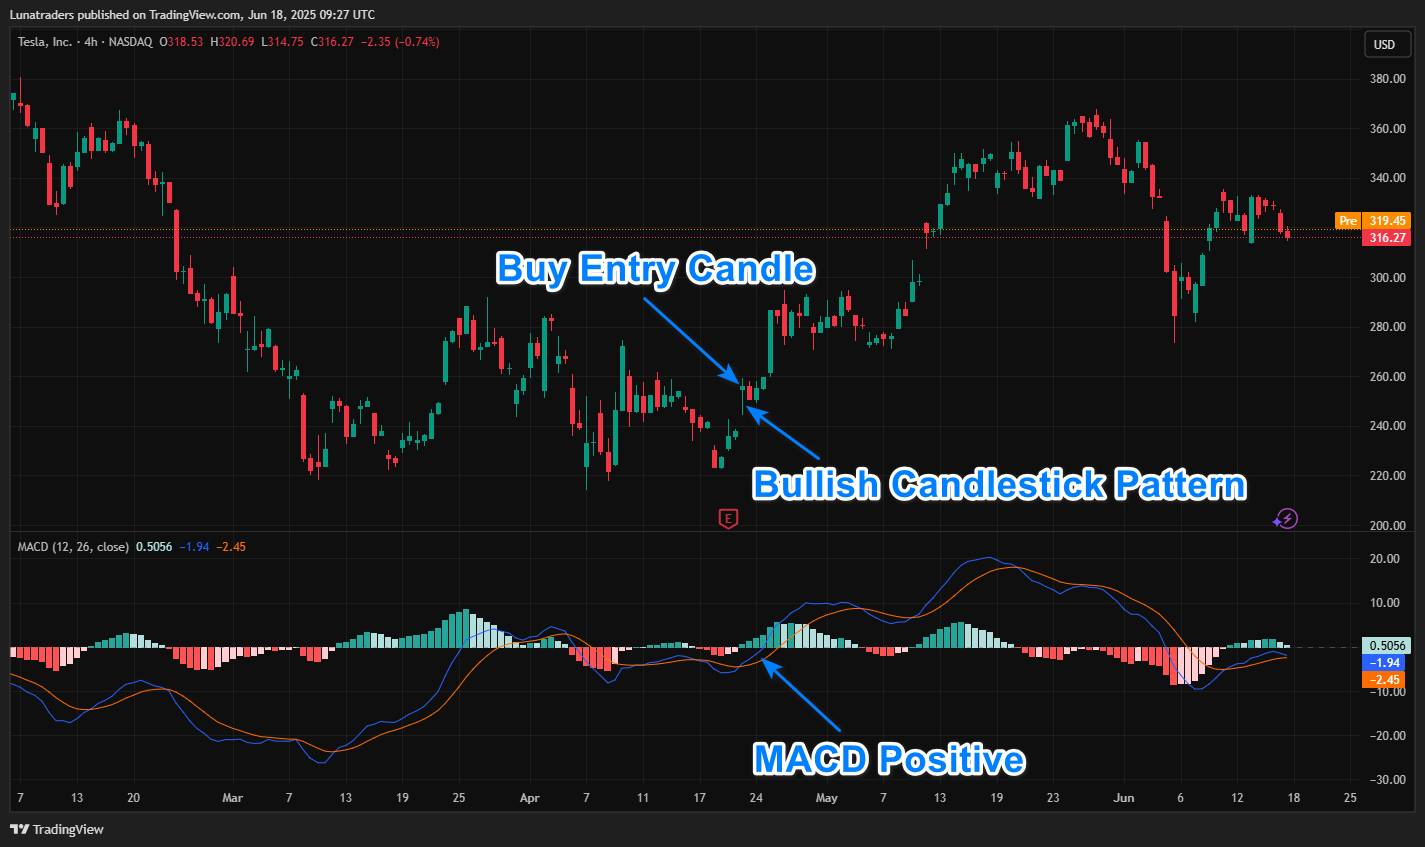
Confirmation Candle
Wait for the candle to close above SuperTrend line.
Use this candle’s close as your entry price.
Stop Loss
Place SL just below the SuperTrend line or the recent swing low.
Take Profit
Option A: 1.5x or 2x Risk-to-Reward Ratio
Option B: Exit when SuperTrend turns red or RSI crosses below 60
✅ Sell Setup
SuperTrend Turns Red (Sell Signal)
A bearish signal is given when the SuperTrend flips from green to red.
RSI Is Between 40 and 60 at Entry
Avoid selling when RSI is <30 (oversold).
Ideal entry when RSI is dropping through 50, confirming bearish strength.
Confirmation Candle
Wait for the candle to close below the SuperTrend line.
Stop Loss
Place SL just above the SuperTrend line or the most recent swing high.
Take Profit
Option A: 1.5x or 2x Risk-to-Reward
Option B: Exit when SuperTrend turns green or RSI crosses above 40
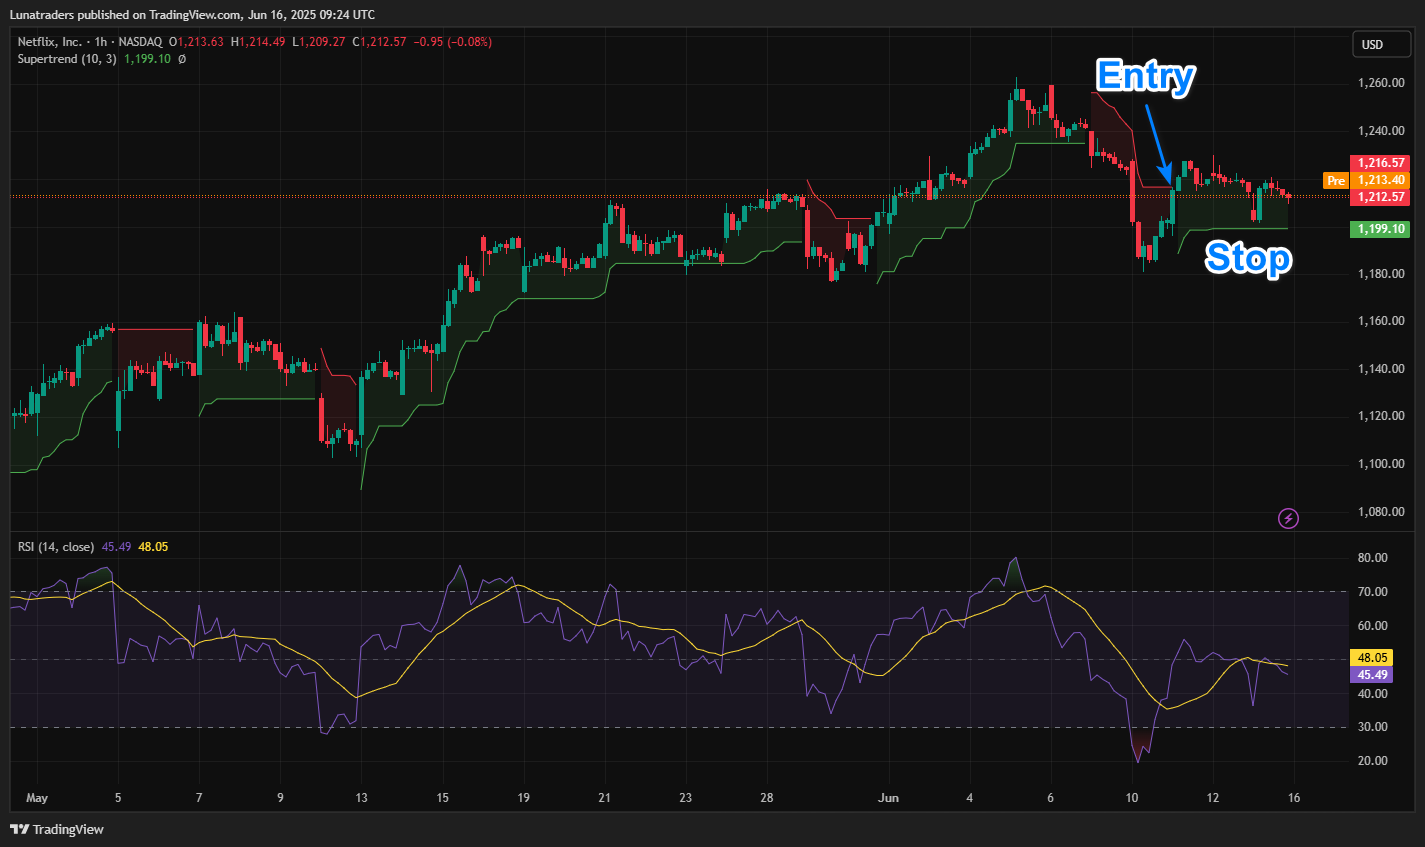
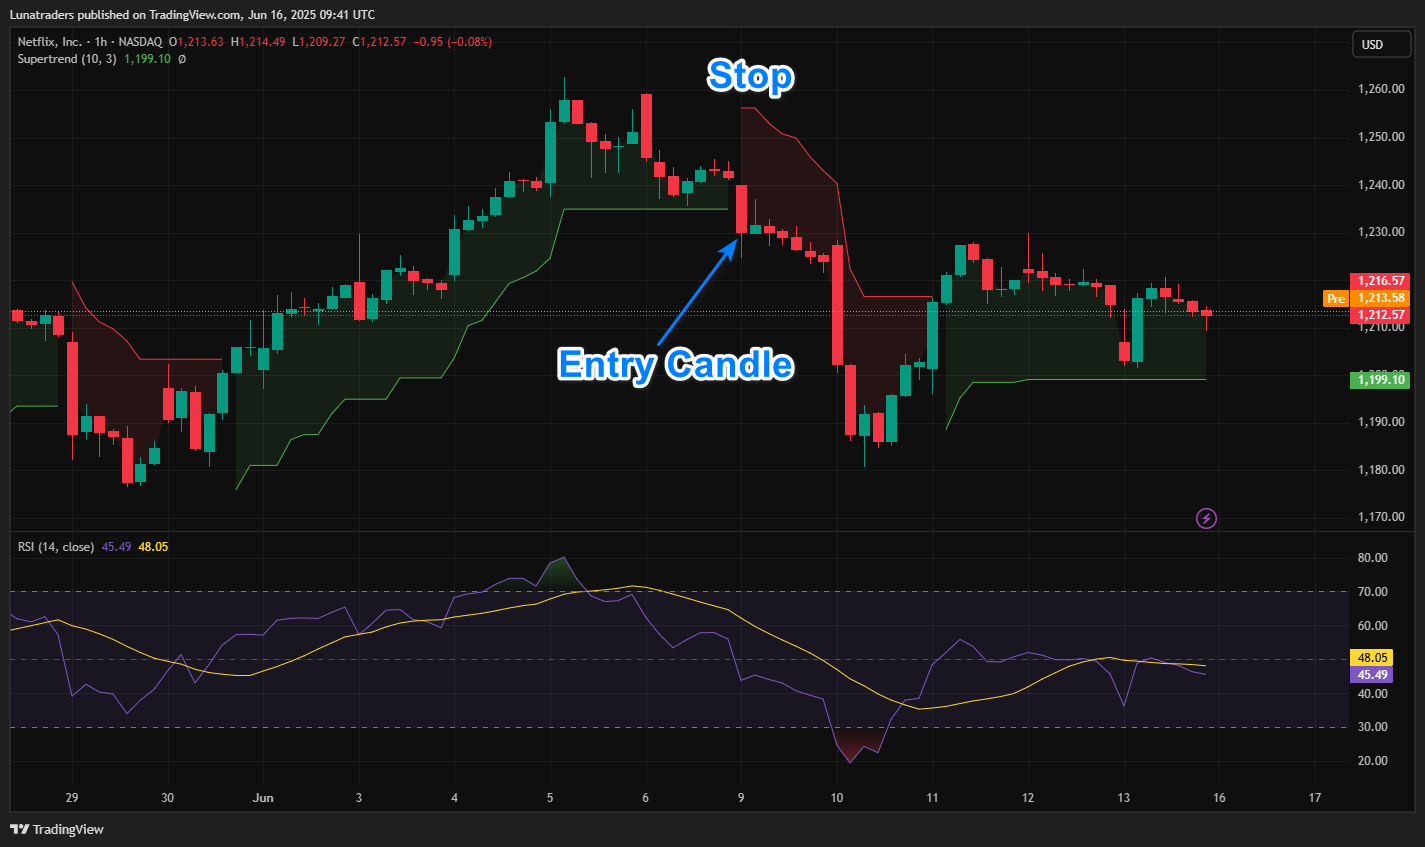
Example Trade: Netflix (NFLX)
Symbol: NFLX
Date: June 13, 2025
Timeframe: 1-Hour
Entry Price: $1,212.15
Stop Loss: $1,204.00
Target: $1,225.20
On this day, SuperTrend flipped green and RSI crossed above 50, confirming upward momentum. The price rallied and hit the target within five hours — a textbook SuperTrend + RSI trade.
Backtest Performance Snapshot
| Metric | Result |
|---|---|
| Win Rate | 61% |
| Avg R:R | 1.65:1 |
| Avg Hold Time | 2–6 hours |
| Max Drawdown | -4.2% |
Tips for Success
- Use the strategy only during high-volume sessions (e.g. US Open).
- Avoid trading during earnings announcements or major news releases.
- Use the 200 EMA as a trend filter to avoid counter-trend entries.
- Combine with pre-market support/resistance zones for better entries.
Who Is This Strategy For?
This strategy is ideal for:
- Intraday traders looking for 1–2 quality setups per day
- Traders who want to avoid overcomplicated systems
- Options traders who need accurate directional entries
🔓 Enhance It With Barracuda
Want this strategy built-in with automatic entries, stop loss, take profit, and alerts? Check out the premium Barracuda Indicator for TradingView.
Final Thoughts
The SuperTrend + RSI strategy for the 1-hour chart gives you a balanced approach to short-term trading.
With just two reliable indicators and a strict rule set, you can trade stocks, forex, or crypto with clarity and confidence.