Introduction
The Barracuda Price Action + Stochastic Oscillator Strategy is a precision-based swing trading system that combines price structure with momentum.
By analyzing key support and resistance levels along with the Stochastic Oscillator, traders can catch high-probability reversals and trend continuations with greater confidence.
Why This Strategy Works
This strategy works by aligning price action, such as breakouts or pullbacks near significant zones, with the momentum shifts identified by the Stochastic indicator.
When both the market structure and momentum agree, entries have a higher chance of success. It filters out noise and improves timing, especially in ranging or trend-transition phases.
🔓 Insider Tip: Trade Smarter with the Barracuda Indicator on Autopilot.
Searching for a smarter way to trade with automated entries, stops, targets, and alerts?
Take your trading to the next level with the 🔗 Premium Barracuda Indicator for TradingView.
Strategy Overview
- Market Type: Trending or ranging with clear S/R levels
- Indicators: Stochastic Oscillator (14, 3, 3) + Price Action Structure
- Timeframe: Works best on 15min, 1H, and 4H charts
- Assets: Forex, crypto, indices, and stocks
TradingView Indicators Used
- Stochastic Oscillator: Measures overbought/oversold conditions (Default: %K=14, % D=3)
- Barracuda Price Zones: (support/resistance and key candle structures – manual or using an indicator)
Buy Entry Conditions
- The price is near a support level or breaking above resistance.
- Stochastic is crossing upward from below the 20 level (oversold).
- Bonus: Bullish engulfing or strong reversal candle confirmation.
Example Buy Setup
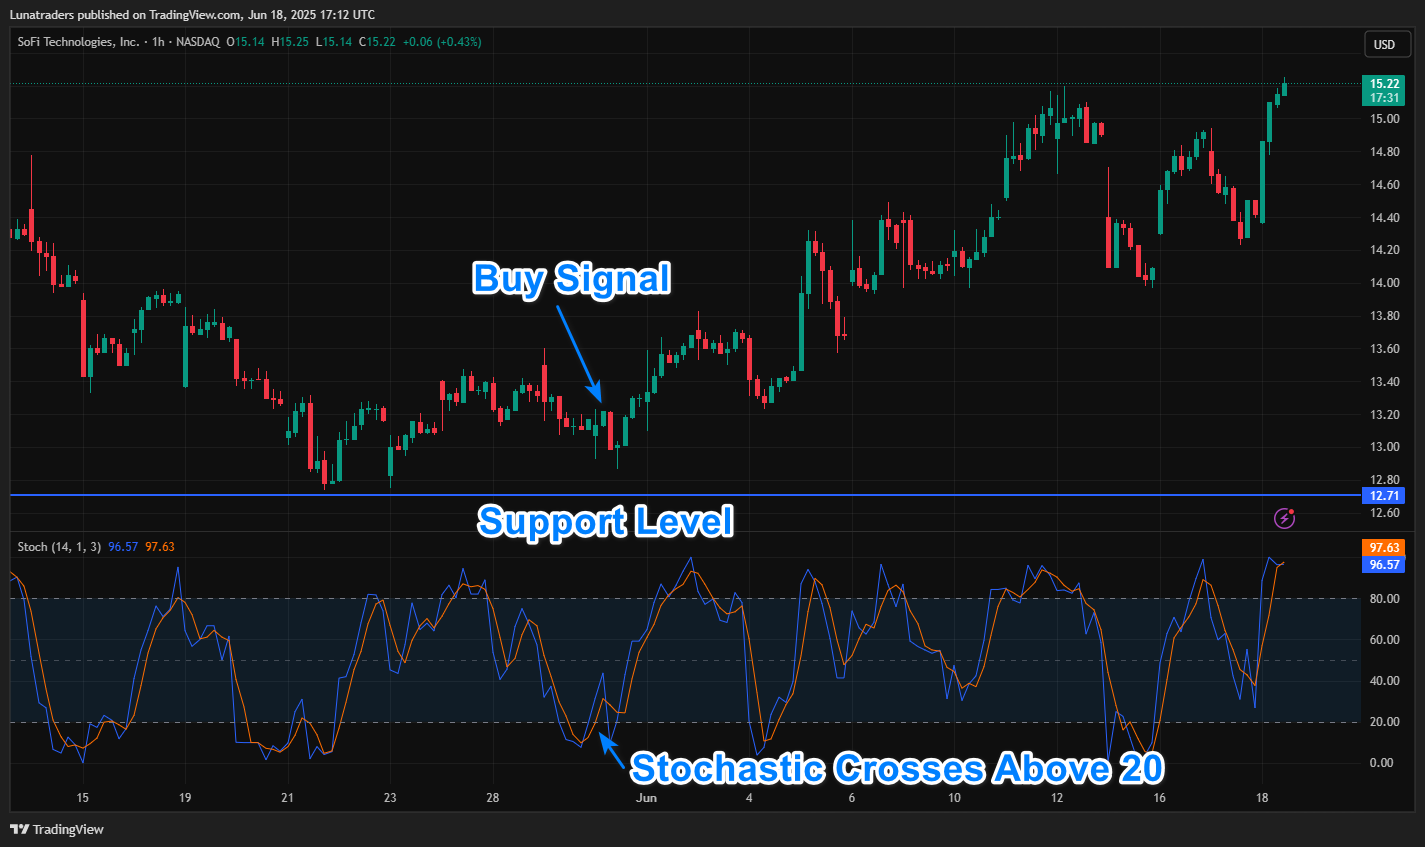
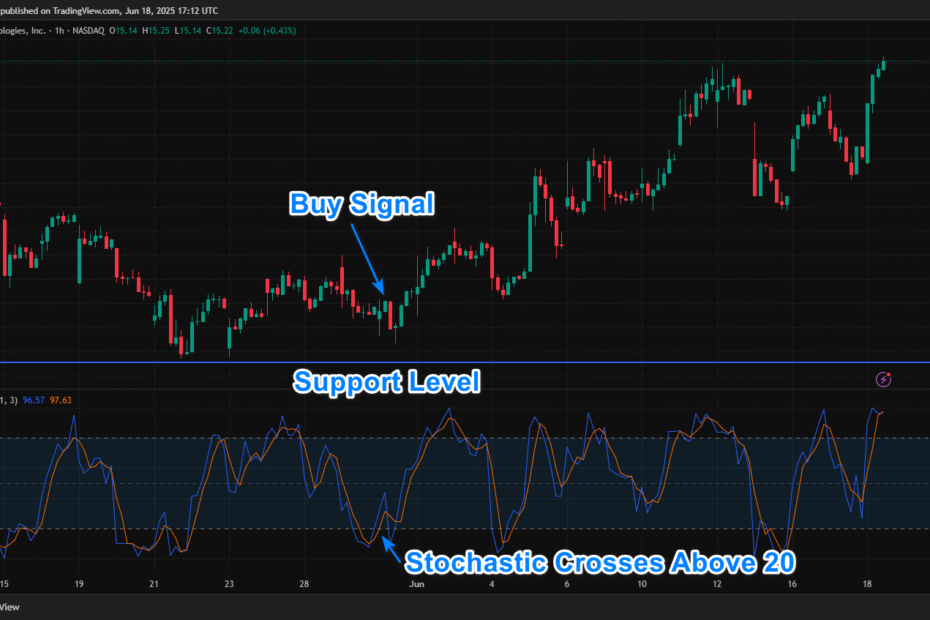
Sofi Technologies 1H stock chart: Price pulls back to a previous support level.
A bullish candle forms, and Stochastic crosses upward from below 20.
This is a valid buy entry.
Sell Entry Conditions
- The price is near a resistance level or breaking below support.
- Stochastic is crossing downward from above the 80 level (overbought).
- Bonus: Bearish engulfing or rejection wick from resistance.
Example Sell Setup
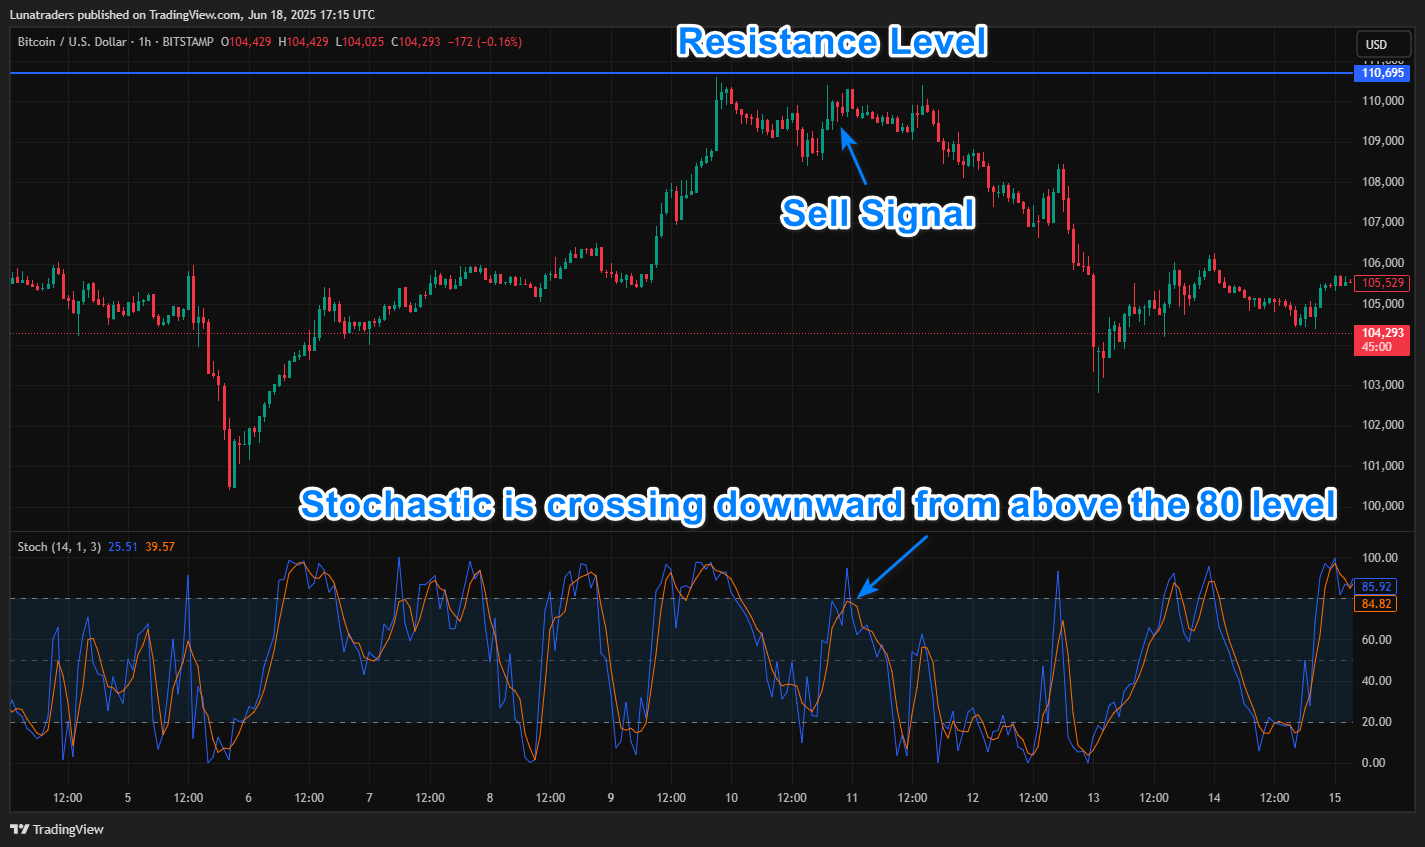
BTCUSD 1H: Price spikes into a resistance level but gets rejected, failing to break above.
Simultaneously, the Stochastic crosses downward from above 80.
This creates a valid sell signal.
Stop Loss & Take Profit Rules
- Stop Loss: Just below support for buys, or just above resistance for sells. Alternatively, use the recent swing low/high.
- Take Profit: 1:2 or 1:3 risk-reward. Optional: use trailing stop after 1:1 is reached.
Backtesting & Optimization Tips
For effective results, start by using TradingView’s built-in Strategy Tester to simulate historical performance and fine-tune your approach.
The Bar Replay feature is also excellent for visually stepping through past price action and manually testing your strategy in real-time conditions.
Test the strategy across multiple assets (e.g., major forex pairs, stocks, indices, or crypto) and various timeframes (15min, 1H, 4H) to discover where it performs best.
Some instruments may respond better to momentum-based entries, while others might favor longer consolidation breakouts.
You can tweak the Stochastic parameters for more reactive or smoother signals—for example, testing combinations like (12, 3, 3) or (9, 5, 5). Smaller settings give faster signals, while higher ones reduce noise.
Finally, always forward-test your optimized settings on a demo account before going live, and adjust based on real-market behavior. Market conditions change, so regular re-evaluation is key.
🔓 Unlock Smarter Trading with the Barracuda Indicator
Ready to trade with an indicator that gives accurate entries, defined SL/TP levels, and instant notifications?
Start trading with the 🔗 Premium Barracuda Indicator for TradingView.
Other Indicator Combinations to Explore
Looking to enhance or diversify your strategy?
The Barracuda Price Action + Stochastic setup can be combined with other indicators for added confirmation or filtering.
Here are a few powerful combinations worth exploring:
- EMA200 + Stochastic + Price Action: Filter trades in the direction of the long-term trend for higher win probability.
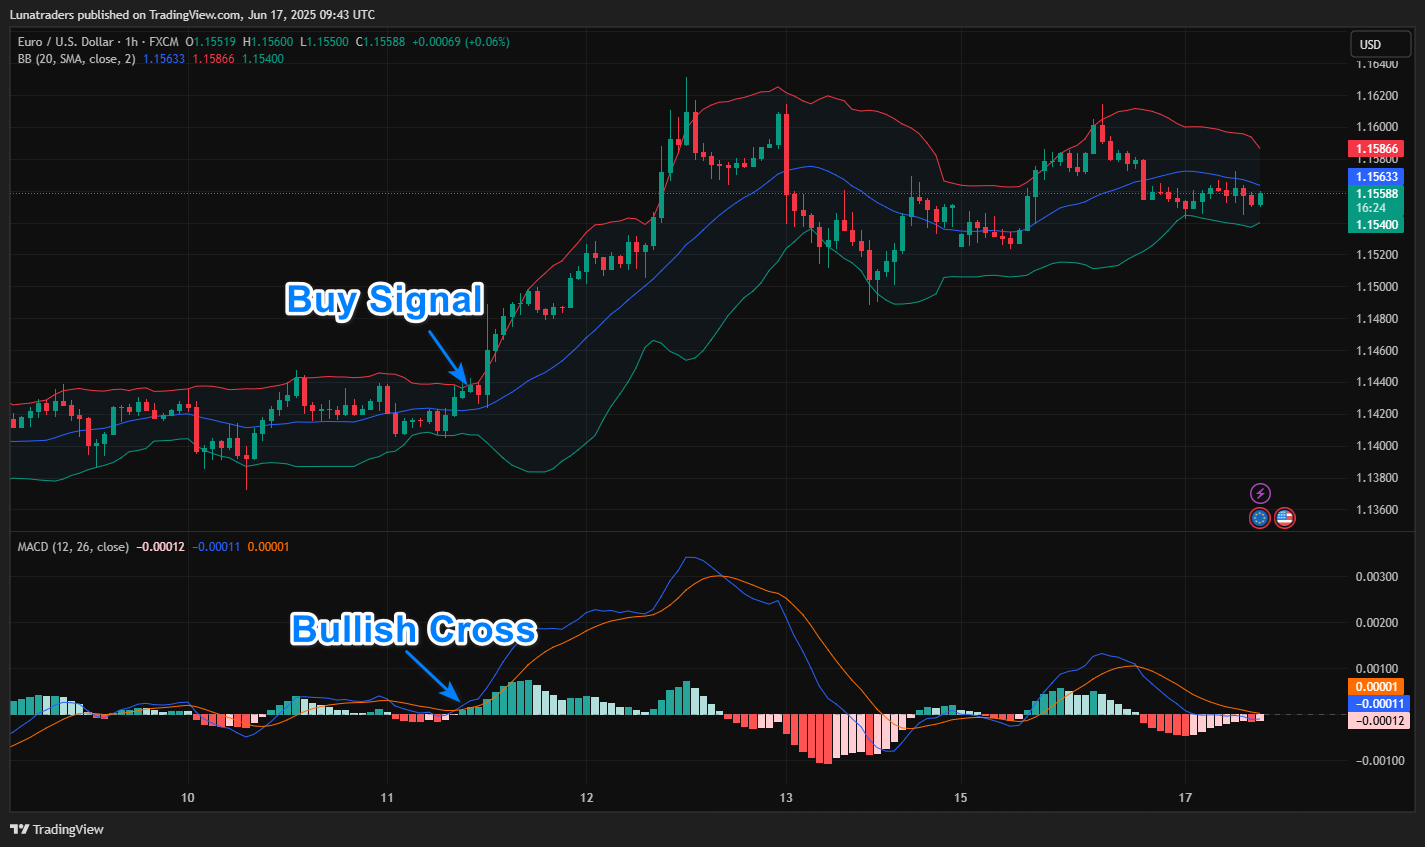
- Bollinger Bands + Stochastic: Use Bollinger Band extremes to confirm overbought/oversold signals from Stochastic.
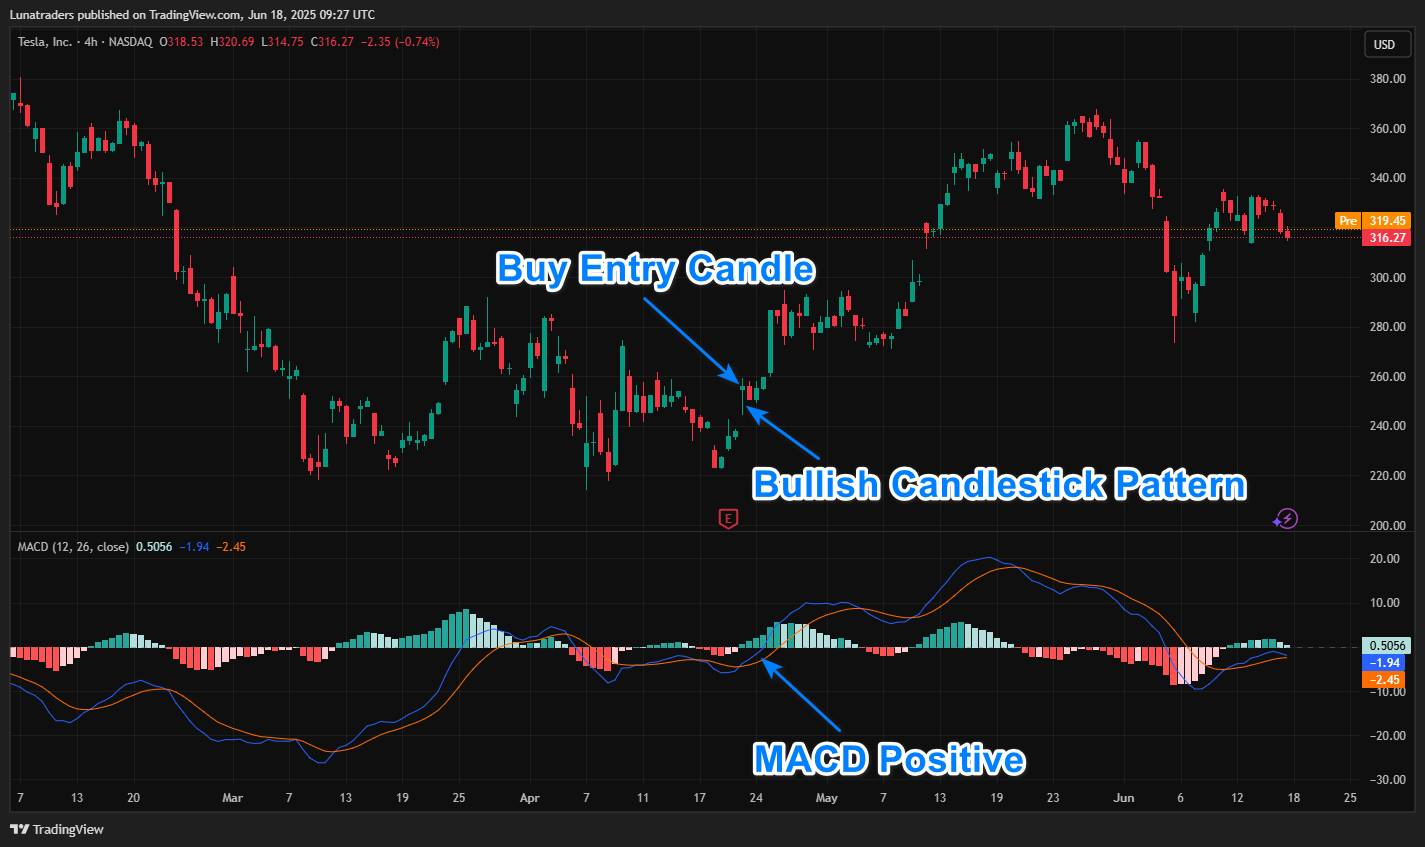
- MACD + Price Action: Identify momentum shifts and trend reversals with MACD crossovers and histogram divergence.
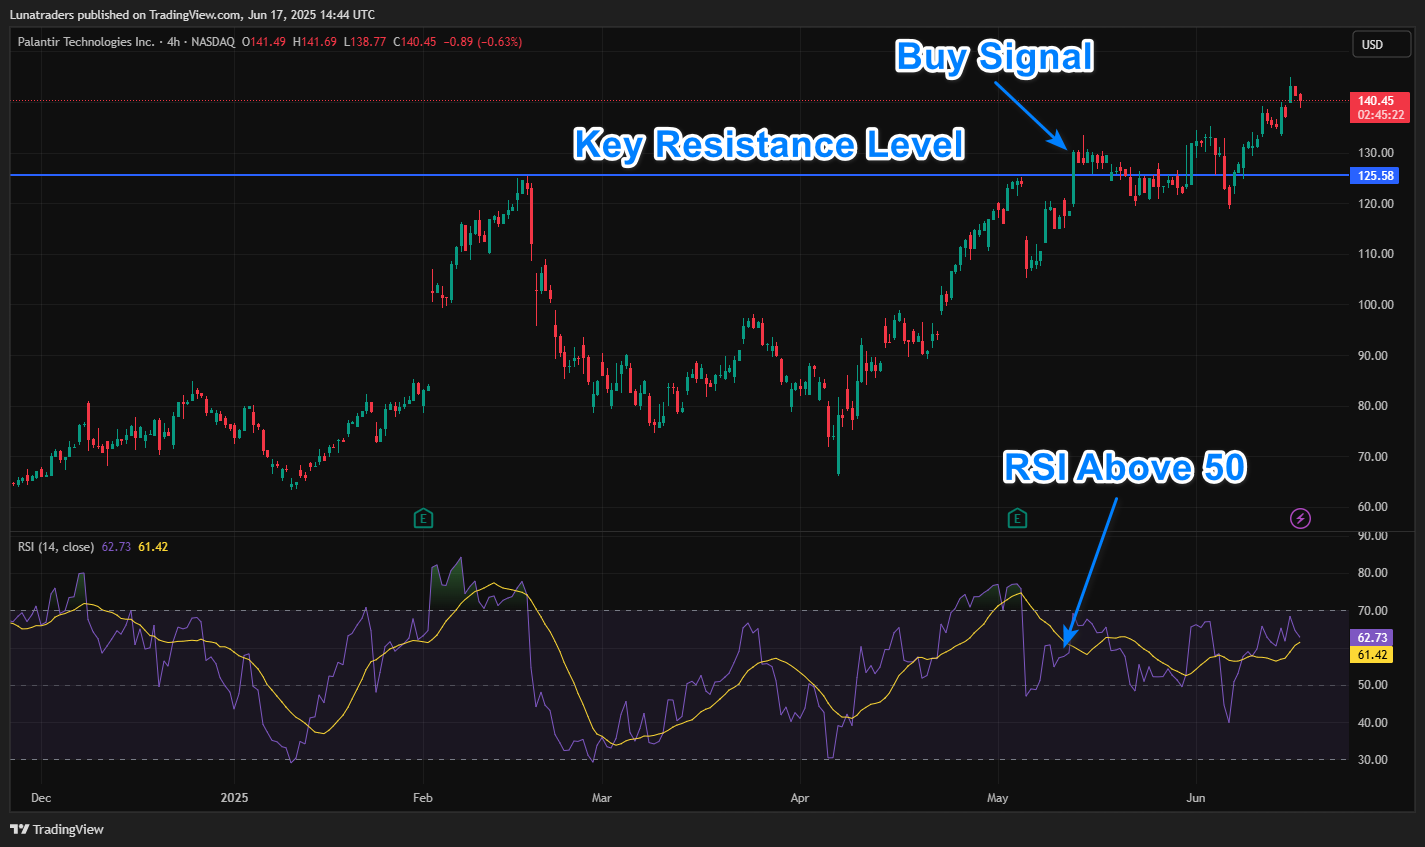
- RSI + Stochastic: Double momentum confirmation for stronger reversal entries.
- ATR + Price Action: Use ATR to dynamically adjust stop-loss and take-profit levels based on current market volatility.
Experiment with these combinations in your backtesting to find what best fits your trading style and the markets you trade.
TradingView Strategy Code (Pine Script v5)
//@version=5
strategy("Barracuda Price Action + Stochastic Strategy", overlay=true, default_qty_type=strategy.percent_of_equity, default_qty_value=10)

k = ta.stoch(close, high, low, 14)
d = ta.sma(k, 3)
stochCrossUp = ta.crossover(k, d) and k < 20
stochCrossDown = ta.crossunder(k, d) and k > 80

supportLevel = request.security(syminfo.tickerid, "D", ta.lowest(low, 20))
resistanceLevel = request.security(syminfo.tickerid, "D", ta.highest(high, 20))

longCondition = stochCrossUp and close > supportLevel
shortCondition = stochCrossDown and close < resistanceLevel

if longCondition
    strategy.entry("Buy", strategy.long)

if shortCondition
    strategy.entry("Sell", strategy.short)

strategy.exit("TP/SL Long", from_entry="Buy", loss=100, profit=200)
strategy.exit("TP/SL Short", from_entry="Sell", loss=100, profit=200)
Final Thoughts
The Barracuda Price Action + Stochastic Strategy offers a powerful way to trade using confluence between momentum and key price levels.
It helps traders avoid false signals and improve timing.
Combine this manual method with the Premium Barracuda Indicator to automate alerts, entries, and take your results to the next level.