Trading success doesn’t always require a complicated web of indicators. Sometimes, simplicity backed by logic delivers the most consistent edge.
The “Awesome Price Action and RSI Combo Strategy” is a clean, effective system designed for traders who prefer precision entries rooted in raw price behavior and momentum confirmation.
This strategy combines two powerful concepts: Price Action and the Relative Strength Index (RSI).
Price action highlights key market structure points such as breakouts, retests, and rejection candles, while RSI confirms whether momentum is truly aligned with the setup.
Why This Combo Strategy Works
- Price action reveals what traders are doing.
- RSI confirms when momentum is supporting that behavior.
The synergy between these two gives you a refined entry filter that avoids weak signals and choppy markets.
🔓 Premium Tip: Let the Barracuda Indicator Trade for You.
Want an indicator that provides intelligent entries, stop loss, take profit targets, and instant alerts?
Take your trading to the next level with the Premium Barracuda Indicator for TradingView.
🔗 Discover the Barracuda Indicator Today
Strategy Overview
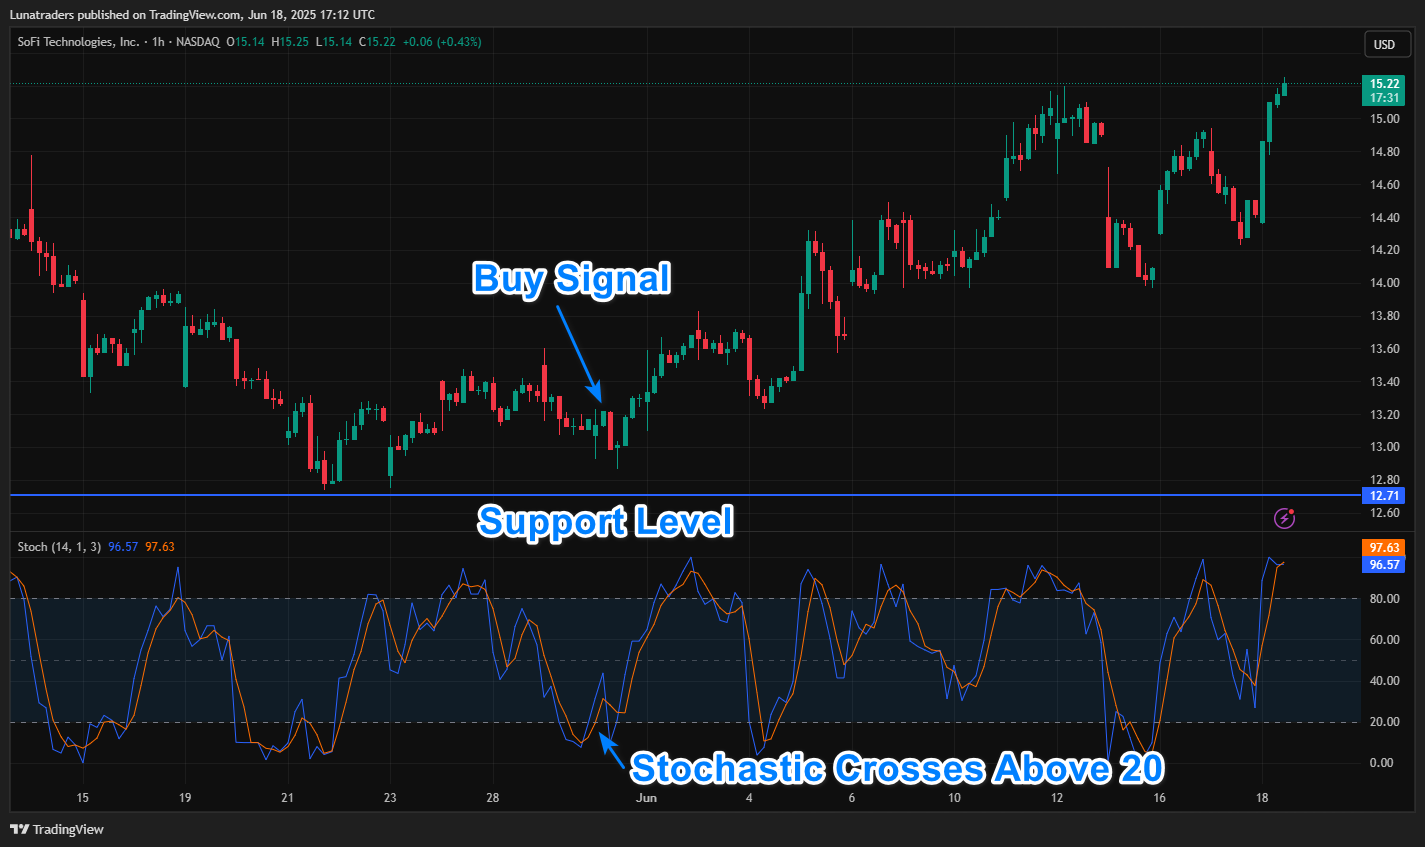
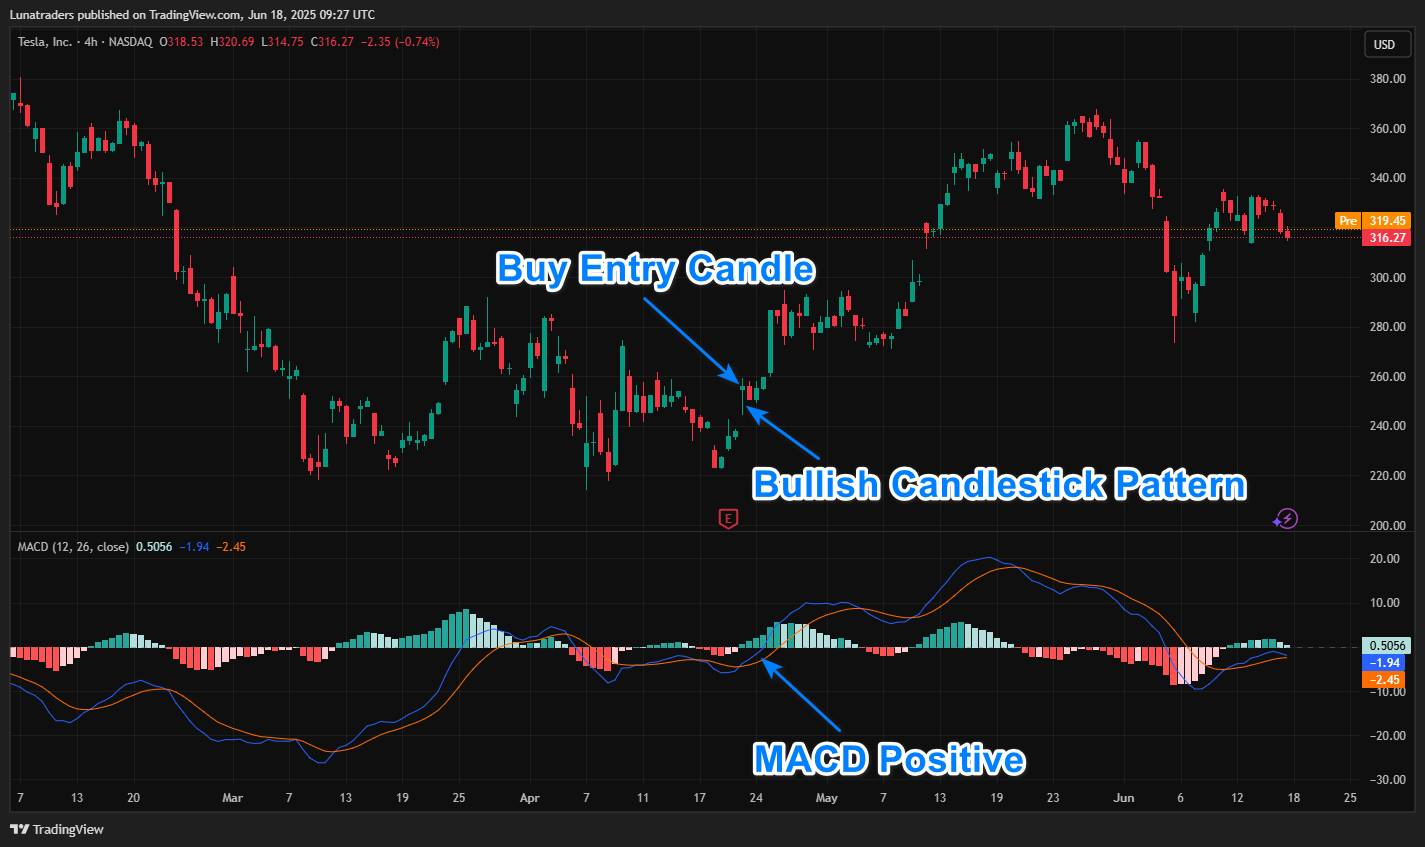
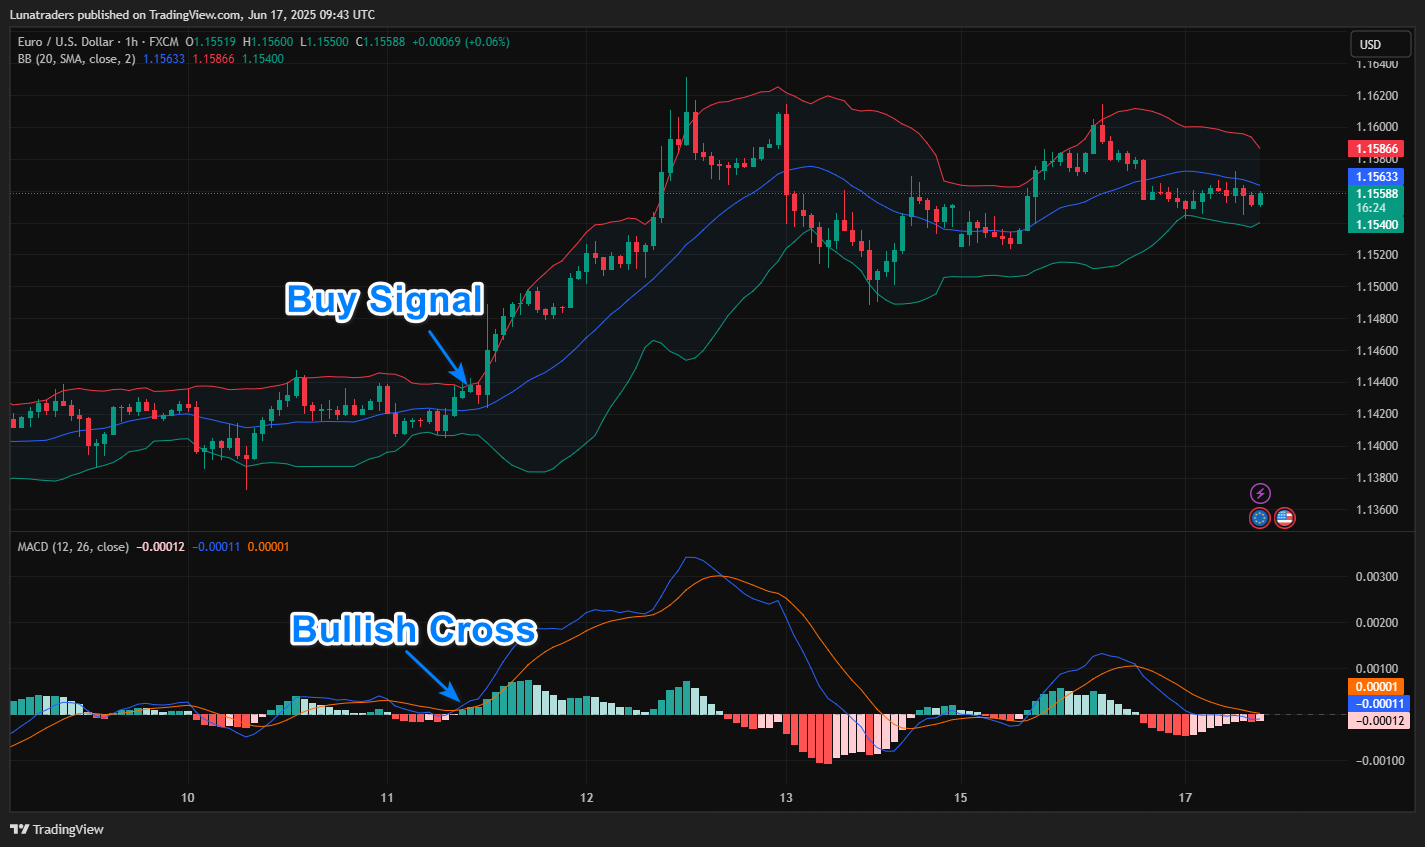
This is a trend-following trading system that combines classic price action structure, such as support and resistance levels, and breakout candles, with RSI confirmation to enhance entry accuracy.
By focusing on key zones where price has historically reacted, and waiting for decisive breakout behavior, the system filters for strong directional moves.
The RSI (Relative Strength Index) acts as a momentum gauge, confirming whether the breakout aligns with underlying market strength.
This dual-layered approach helps eliminate false signals and ensures entries are backed by both structure and momentum.
The primary objective of this system is to capture high-probability trade setups within the prevailing trend, entering only when there is technical evidence of both commitment and continuation.
TradingView Indicators Used
- Relative Strength Index (RSI) (14-period, standard)
- Support/Resistance Levels (manual or indicator)
- Optional: Candlestick pattern recognition or swing high/low tool
Buy Entry Conditions
- Price breaks above a key resistance level.
- The breakout candle closes strongly above resistance.
- RSI is above 50, showing bullish momentum.
- Optional: retest of the previous resistance (now support) with bullish confirmation candle (e.g., hammer, engulfing).
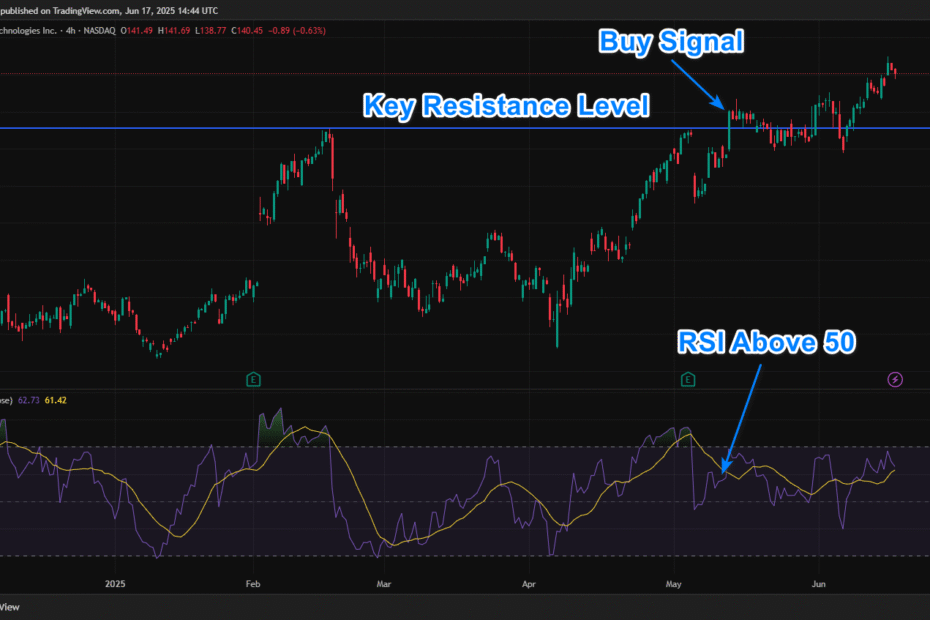
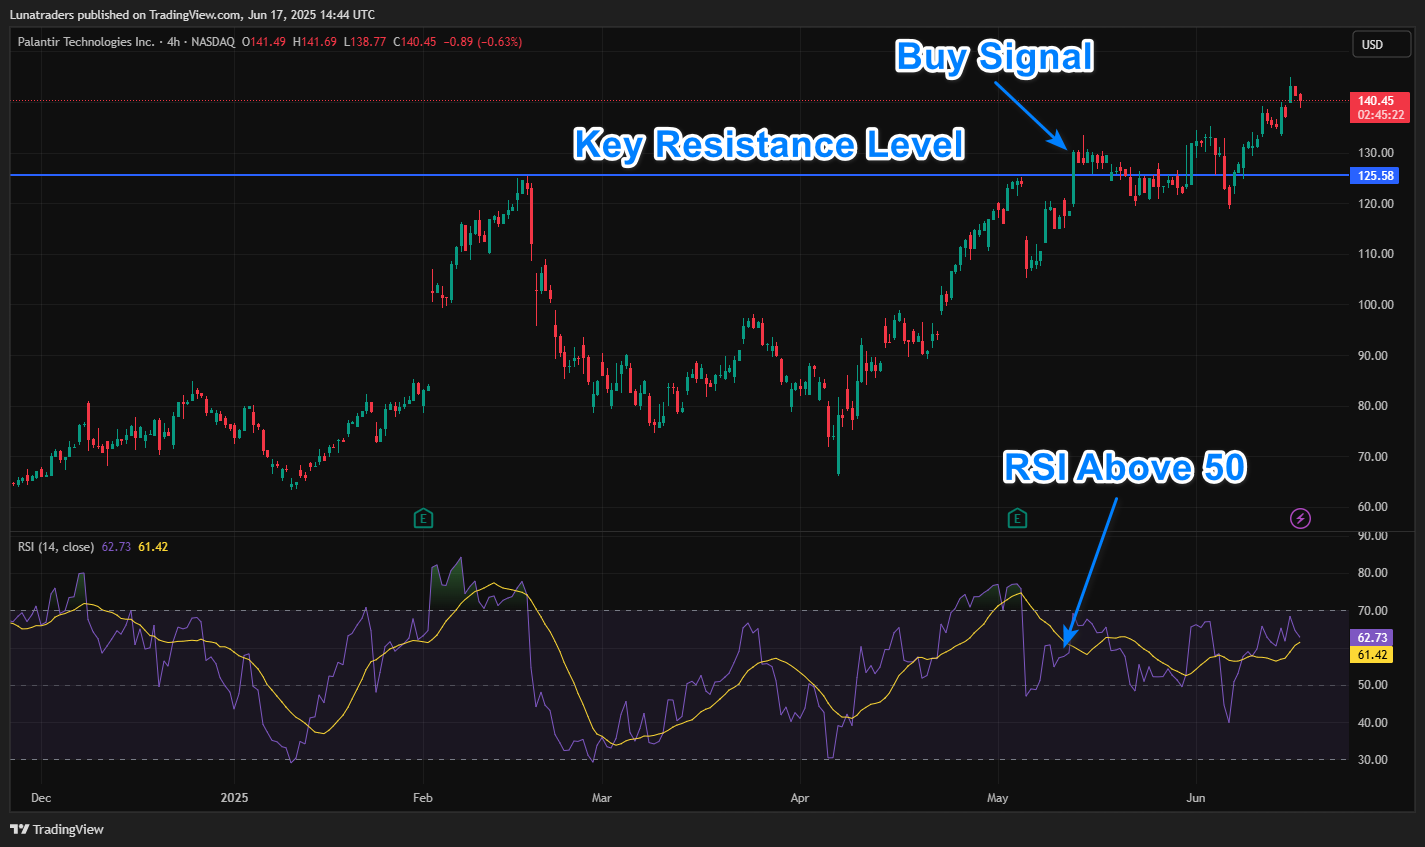
Example Buy Setup (Palantir Technologies stock)
Palantir breaks a 4H key resistance zone.
The breakout candle closes with a large bullish body.
RSI reads 58.
Buy entry is taken with a stop below the most recent swing low price.
Sell Entry Conditions
- Price breaks below a key support level.
- The breakdown candle closes strongly below support.
- RSI is below 50, showing bearish momentum.
- Optional: retest of the previous support (now resistance) with a bearish confirmation candle.
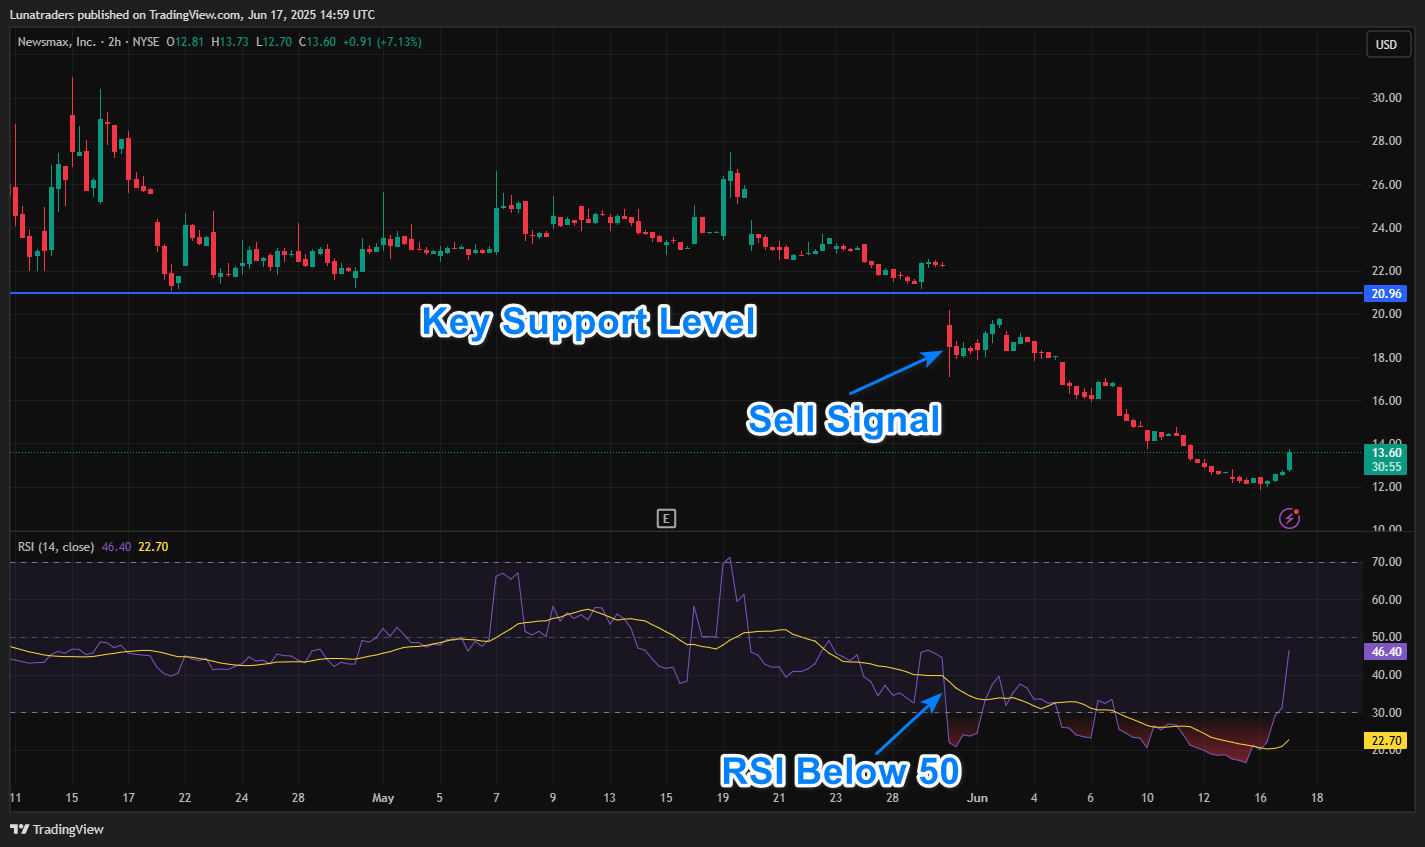
Example Sell Setup (Newsmax Stock)
Newsmax stock breaks the 2-hour chart key support zone.
The candle closes strongly below the level.
RSI is at 38.
Sell entry is taken with a stop above the most recent swing high zone.
Stop Loss & Take Profit Rules
- Stop Loss: Just beyond the confirmation candle’s high/low.
- Take Profit 1: 1:1 Risk-to-Reward Ratio
- Take Profit 2: Key swing level or trailing stop using recent price structure.
- Optional: Use RSI divergence as an early exit signal.
Backtesting & Optimization Tips
- Test on trending markets (Forex, Crypto, Major Indices).
- Avoid ranging conditions or use filters (e.g., ADX > 20).
- Use bar replay mode in TradingView for visual backtesting.
- Adjust RSI length (e.g., 10, 14, 21) to match asset volatility.
- Experiment with different confirmation patterns (engulfing, pin bar, etc.).
🔓 Unlock Smarter Trading with the Barracuda Indicator
Want to automate your strategy with intelligent entries, stop loss, take profit targets, and instant alerts?
This is exactly what the Premium Barracuda Indicator for TradingView is built to do.
Whether you’re trading forex, crypto, or indices, Barracuda adapts and delivers.
🔗 Discover the Barracuda Indicator Today
TradingView Strategy Code (Pine Script v5)
//@version=5
strategy("Price Action + RSI Combo", overlay=true, default_qty_type=strategy.percent_of_equity, default_qty_value=10)

rsi = ta.rsi(close, 14)
breakAbove = close > ta.highest(close[1], 20)
breakBelow = close < ta.lowest(close[1], 20) buyCond = breakAbove and rsi > 50
sellCond = breakBelow and rsi < 50

if (buyCond)
    strategy.entry("Buy", strategy.long)

if (sellCond)
    strategy.entry("Sell", strategy.short)

// Optional Exit
strategy.exit("TP/SL", from_entry="Buy", profit=2, loss=1)
strategy.exit("TP/SL", from_entry="Sell", profit=2, loss=1)
Final Thoughts
The “Awesome Price Action and RSI Combo Strategy” is simple yet powerful. It filters breakouts with momentum confirmation, offering a logical and time-tested approach.
Whether you’re a manual trader or looking to automate your edge, this system can serve as a strong foundation.
And remember, if you’re looking for even more power, real-time alerts, and smart trade management, let the Barracuda Indicator do the heavy lifting.