The 200-period Simple Moving Average (SMA) strategy is a popular trend-following method used by professional and retail traders alike.
It helps filter trades in the direction of the major trend and provides clear signals on when to buy or sell.
Alongside the 200 SMA, the 20-period Exponential Moving Average (EMA) is often combined to refine entries and exits, capturing shorter-term momentum within the broader trend.
In this strategy guide, you’ll learn the exact entry and exit conditions for both the 200 SMA and 20 EMA crossover strategy, get ready-to-use Pine Script code for TradingView, and see how it works in real market scenarios.
Indicators Used
- 200 SMA
Entry Conditions
Buy Rules
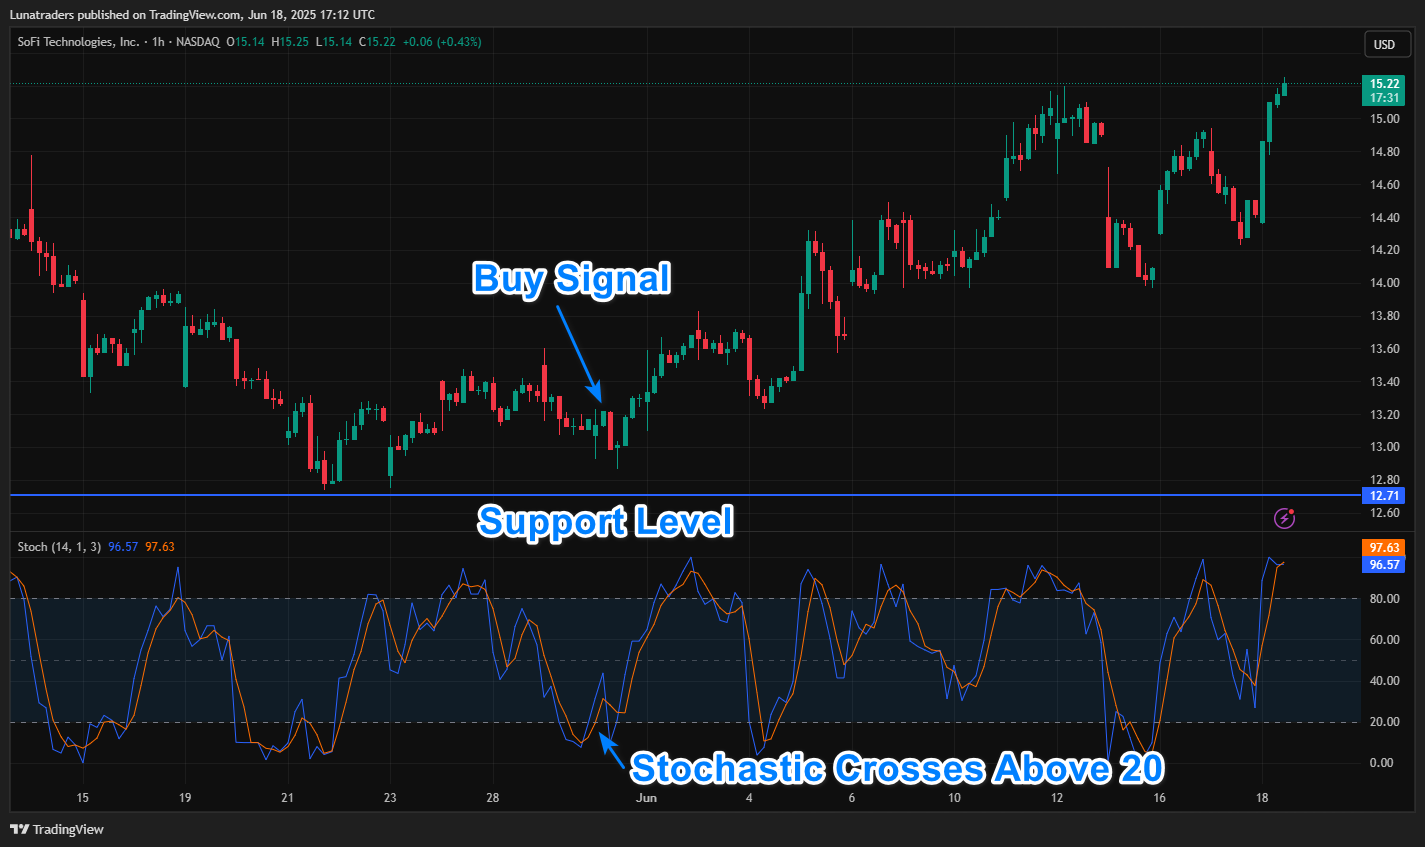
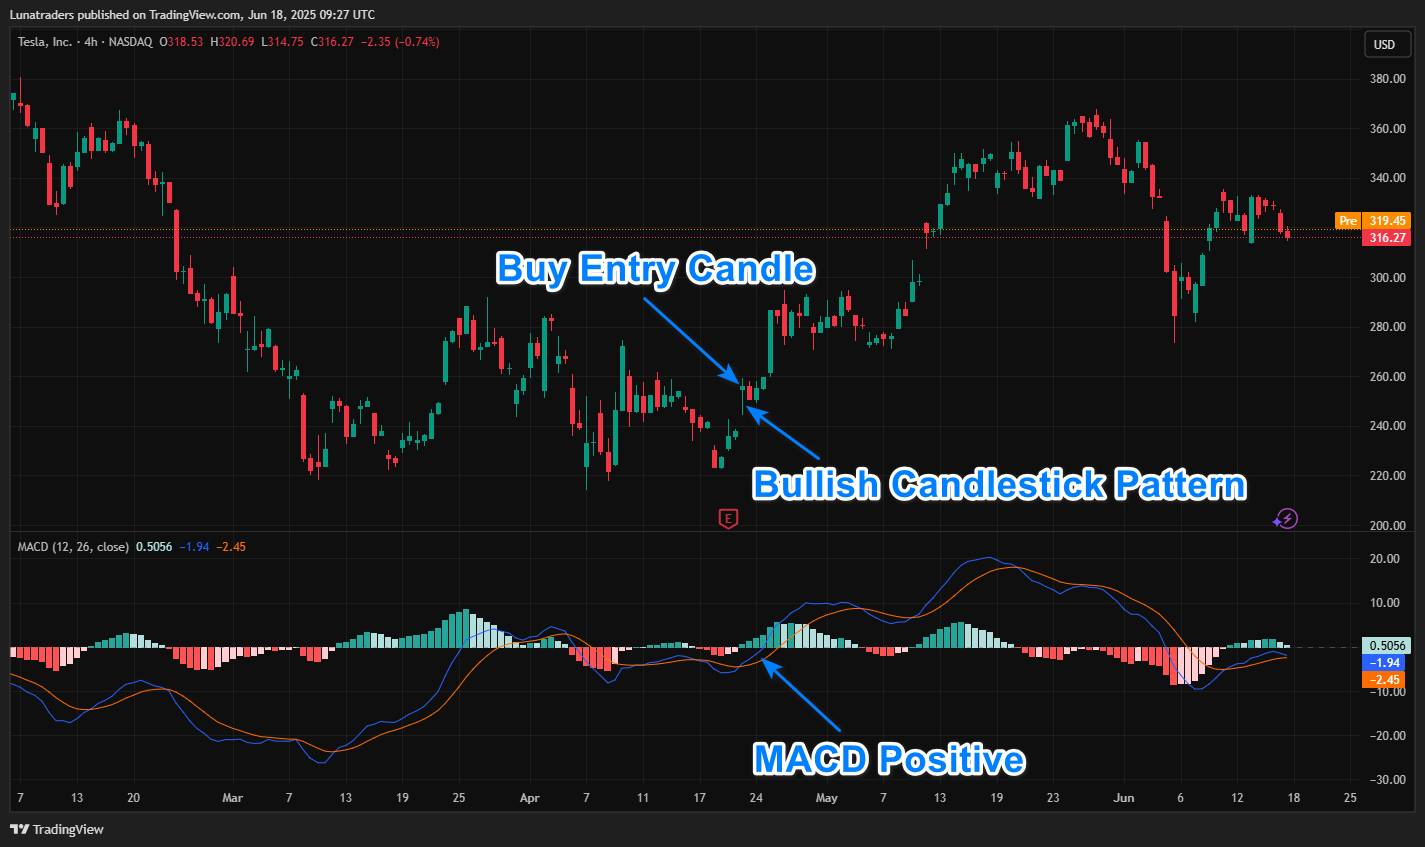
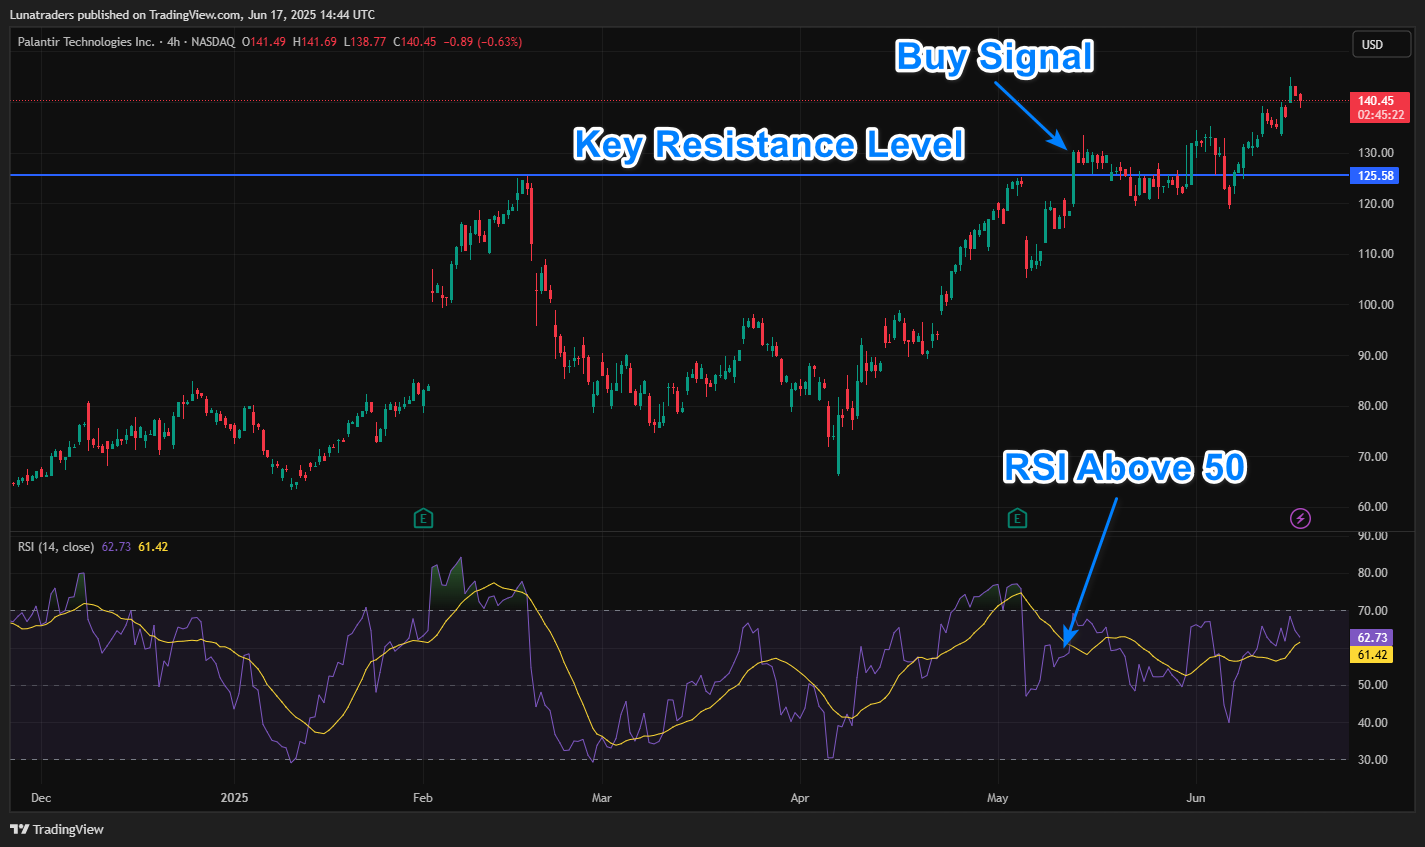
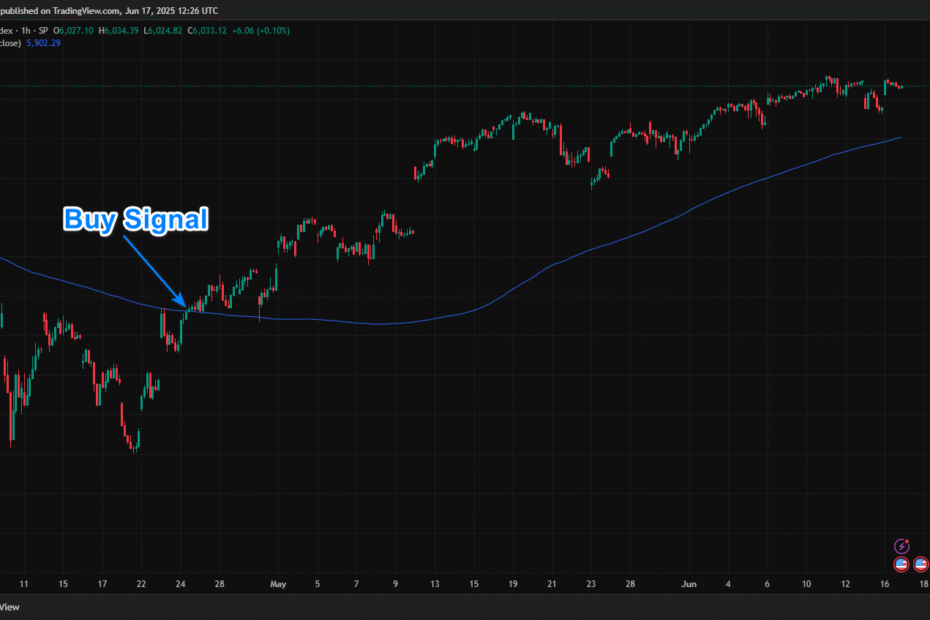
The S&P 500 Index 1-hour chart below illustrates a classic buy trade setup.

- Price must be above the 200 SMA.
- Entry: When price closes above a recent swing high or forms a bullish candle.
- Optional: Confirm with RSI > 50 or MACD bullish crossover.
Sell Rules
The NIO 1-hour stock chart below illustrates a classic sell trade setup.

- Price must be below the 200 SMA.
- Entry: When the price closes below a recent swing low or forms a bearish candle.
- Optional: Confirm with RSI < 50 or MACD bearish crossover.
🔓 Supercharge Your Strategy with the Barracuda Indicator
Want to automate this strategy with precision entries, dynamic stop loss and take profit levels, and real-time alerts—without lifting a finger?
Unlock smarter trading with the Premium Barracuda Indicator for TradingView.
It does the heavy lifting so you can focus on winning trades.
🔗 Discover the Barracuda Indicator Now
Exit Rules & Targets
Option 1: Static TP/SL
- Take Profit: 2x stop-loss distance
- Stop Loss: Below (for long) or above (for short) the recent swing
Option 2: Trailing Stop
- Use ATR or trailing moving average
- Exit on opposite crossover or candle breakout
Pine Script Example (TradingView)
//@version=5
strategy("200 SMA Trend Strategy", overlay=true, default_qty_type=strategy.percent_of_equity, default_qty_value=10)

smaPeriod = 200
sma = ta.sma(close, smaPeriod)

longCondition = close > sma and ta.crossover(close, sma)
shortCondition = close < sma and ta.crossunder(close, sma)

stopLoss = 2 * syminfo.mintick * 100
takeProfit = 2 * stopLoss

if (longCondition)
    strategy.entry("Long", strategy.long)
    strategy.exit("TP/SL Long", from_entry="Long", profit=takeProfit, loss=stopLoss)

if (shortCondition)
    strategy.entry("Short", strategy.short)
    strategy.exit("TP/SL Short", from_entry="Short", profit=takeProfit, loss=stopLoss)

plot(sma, color=color.orange, title="200 SMA")
Advantages
- Simple and beginner-friendly
- Effective in trending markets
- Widely followed by institutions
- Acts as dynamic support/resistance
Drawbacks
- Lagging indicator – late entries
- Prone to false signals in ranging markets
- May underperform without confirmation filters
🔓 Enhance Your Edge with Premium Barracuda Indicator
Want smart trade entries, stop loss, take profit, and instant alerts for any instrument?
Unlock the full power of trading with the Premium Barracuda Indicator on TradingView.
🔗 Get the Barracuda Indicator Now
Backtesting & Optimization
Backtesting Tips
- Use on 1H, 4H, or Daily charts
- Apply to trending pairs (e.g., EUR/USD, NASDAQ)
- Check with and without RSI or MACD filters
Optimization Ideas
- Try EMA(200) instead of SMA
- Add volume or volatility filters
- Test different TP/SL ratios
Real Trading Example
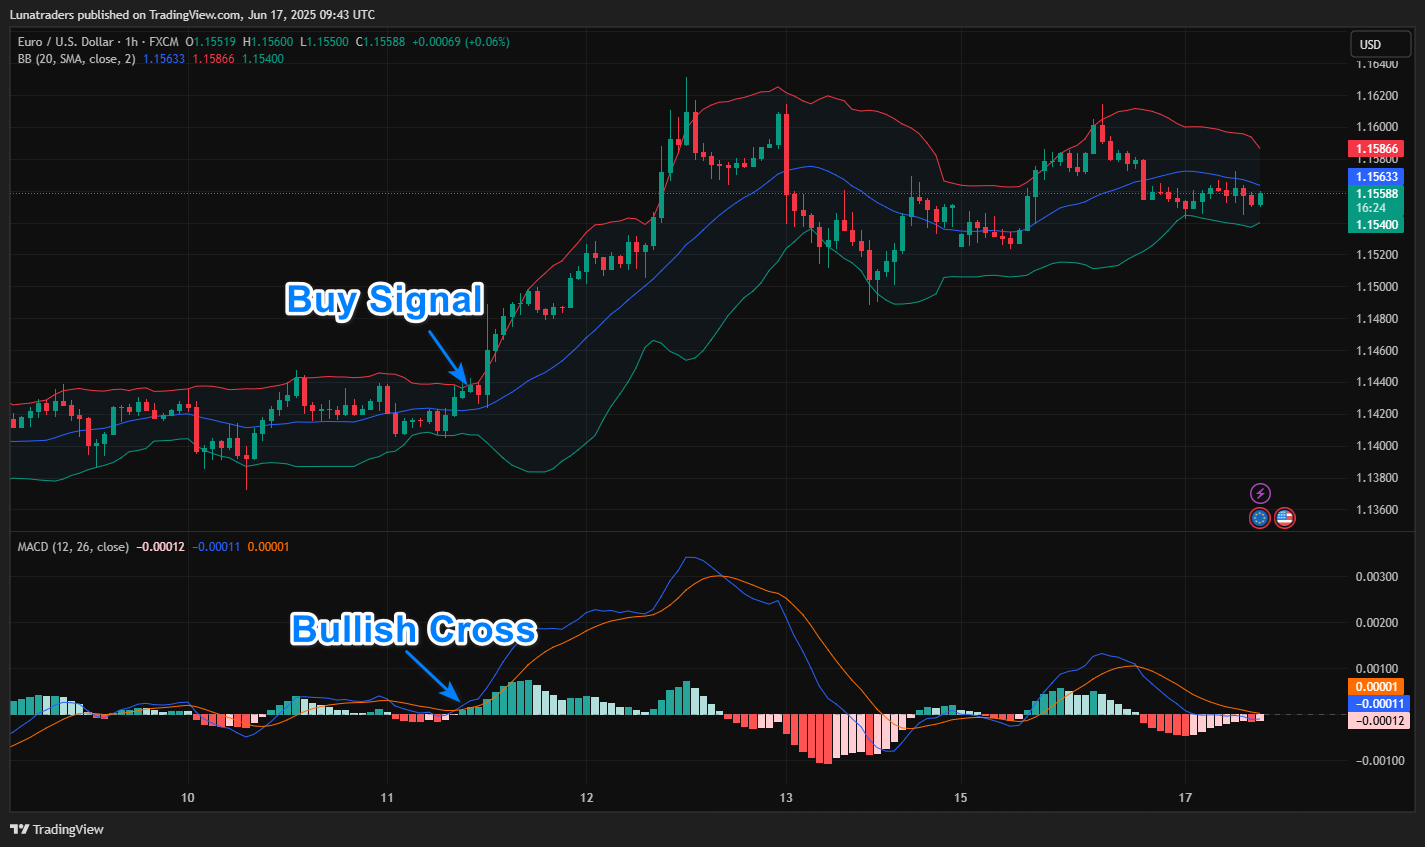
Example 1: EUR/USD Long (4H)
- Price closes above 200 SMA
- RSI > 50 confirms strength
- Trade entered on candle close above the swing high
- SL below swing low, TP at 2:1 reward
Example 2: NASDAQ Short (Daily)
- Price closes below 200 SMA
- MACD bearish crossover
- Short entered, trailed stop to maximize gain
200 SMA + 20 EMA Strategy: A Powerful Combo for Better Trend Trading Success
This hybrid strategy combines the long-term trend filtering power of the 200 SMA with the fast-reacting 20 EMA for entry precision.
Ideal for swing and intraday traders seeking smarter trend-based entries.
✅ Why Combine the 200 SMA with the 20 EMA?
| Indicator | Role | Strength |
|---|---|---|
| 200 SMA | Filters the macro trend | Helps avoid counter-trend trades |
| 20 EMA | Signals entries/exits | Responsive to recent price action |
Why it’s better: Combining both reduces false signals, improves timing, and keeps trades aligned with the dominant trend.
Entry & Exit Rules
The Dow Jones Industrial Average Index 1-hour chart below illustrates a classic buy trade setup.
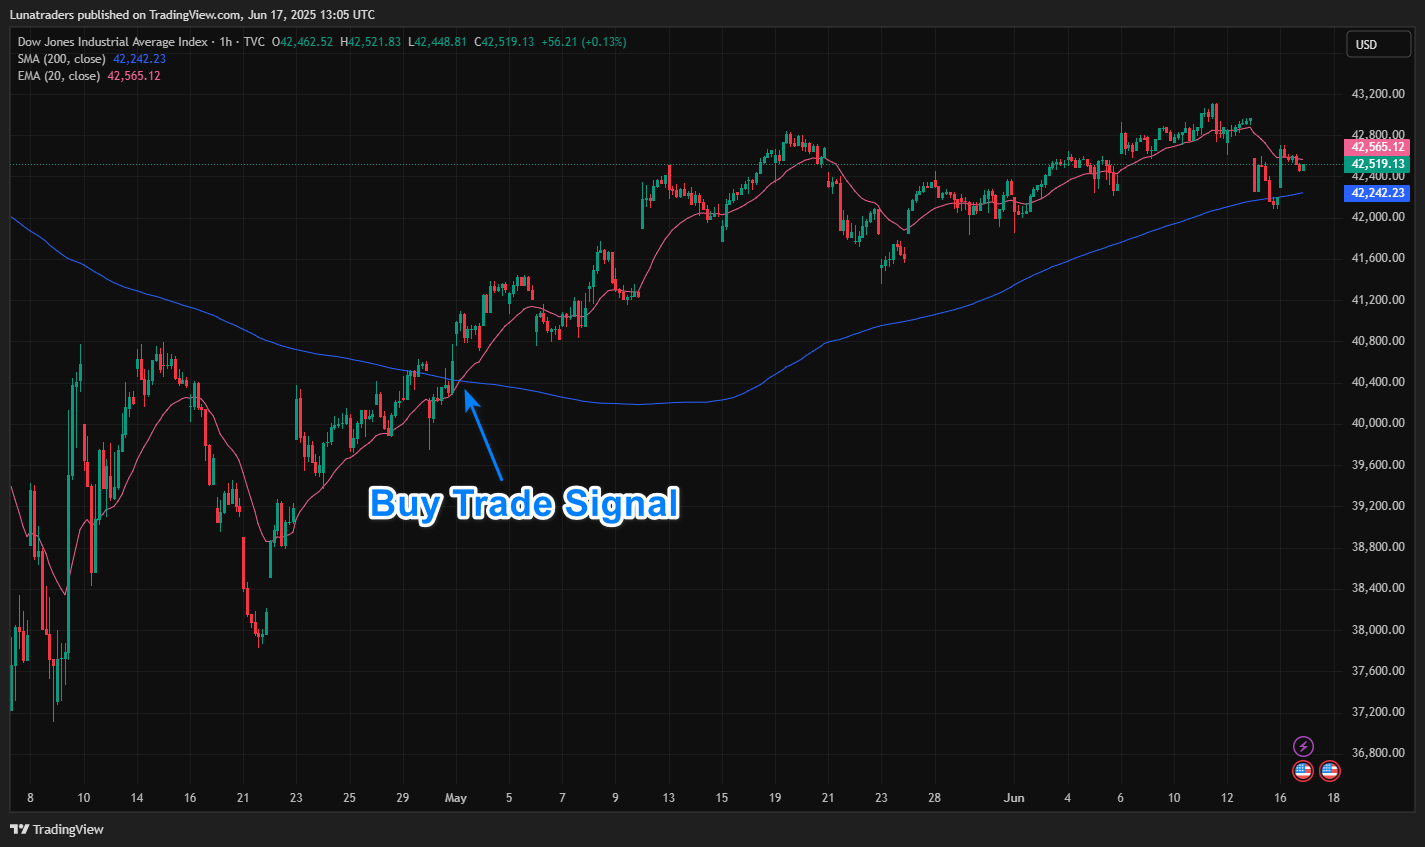
Buy Conditions
- Price is above the 200 SMA (bullish trend)
- Price pulls back to or below the 20 EMA, then closes above it
- Optional: RSI > 50 or bullish candle confirmation
Sell Conditions
- Price is below the 200 SMA (bearish trend)
- Price pulls up to or above the 20 EMA, then closes below it
- Optional: RSI < 50 or bearish rejection candle
Exit Strategy
- Static Stop Loss: Below/above swing low/high
- Take Profit: 1.5–2× stop distance
- Trailing Exit: Exit when price crosses back through the 20 EMA
Pine Script (TradingView)
//@version=5
strategy("200 SMA + 20 EMA Trend Strategy", overlay=true, default_qty_type=strategy.percent_of_equity, default_qty_value=10)

sma200 = ta.sma(close, 200)
ema20 = ta.ema(close, 20)

// Long Condition
longTrend = close > sma200
longEntry = ta.crossover(close, ema20) and longTrend

// Short Condition
shortTrend = close < sma200
shortEntry = ta.crossunder(close, ema20) and shortTrend

// Strategy Logic
stopLoss = 2 * syminfo.mintick * 100
takeProfit = 2 * stopLoss

if (longEntry)
    strategy.entry("Long", strategy.long)
    strategy.exit("TP/SL Long", from_entry="Long", profit=takeProfit, loss=stopLoss)
Conclusion
The 200 SMA Strategy is an excellent tool for aligning trades with the long-term trend. While it may lag and underperform in sideways markets, it shines during clear trends.
Combine it with other indicators for better confirmation and consistent results.